Zaika, O. et al. (2013) J. Am. Soc. Nephrol. 24, 604.
In a rat model of autosomal recessive polycystic kidney disease (ARPKD), the activity of TRPV4 is impaired, the localization of the channel is abnormal and the basal intracellular Ca2+ levels are low.
Immunohistochemical staining of rat kidney sections using Anti-TRPV4 Antibody (#ACC-034) and Anti-Aquaporin 2-ATTO Fluor-550 Antibody (#AQP-002-AO) shows that TRPV4 is preferentially localized to the AQP2-positive distal nephrons. In cyst cells from ARPKD rat model, TRPV4 localization is strongly shifted to the apical membrane (Figure 1B) compared the wild type rats (Figure 1A). A similar shift was observed for AQP-2. Treating rats with a specific TRPV4 activator restored the channel’s distribution and decreased kidney cystic formations, suggesting that TRPV4 treatment could delay the onset of cyst formation in ARPKD.
Figure 1. TRPV4 distribution is shifted toward the apical membrane in cyst cells.Immunohistochemical staining of rat kidney sections using Anti-TRPV4 Antibody (#ACC-034) and Anti-Aquaporin 2-ATTO Fluor-550 Antibody (#AQP-002-AO). Shown are Representative confocal plane micrographs (axes are shown) and corresponding cross-sections (pointed by arrows) showing three-dimensional stacks of TRPV4 (green), AQP2 localization (red), and the combined image localization (yellow). A. Wild-type Sprague-Dawley (S/D) rat. B. Cyst monolayer from a PCK453 rat. DAPI staining is shown in blue.Adapted from Zaika, O. et al. (2013) with permission of the American Society of Nephrology.
King, J.H. et al. (2013) Cardiovasc. Res. 99, 751.
A gain of function in the gene encoding the ryanodine receptor 2 (RYR2) channel was shown to cause slowed conduction velocity (CV) in murine hearts.
Electrophysiological measurements and immuno-fluorescent experiments using Anti-NaV1.5 (SCN5A) (493-511) Antibody (#ASC-005) (Figure 1) show that NaV1.5 function and expression are compromised in the mouse atria containing the above mentioned mutation.
Figure 1. Decreased expression of NaV1.5 in RyR2s/s atria.Immunohistochemical staining of mouse atria using Anti-NaV1.5 (SCN5A) (493-511) Antibody (#ASC-005), Anti-NaV1.6 (SCN8A) Antibody (#ASC-009) and Anti-SCN1A (NaV1.1) Antibody (#ASC-001). NaV1.5 staining in RyR2s/s atria is lower compared to wild type levels. NaV1.6 staining slightly decreased in RyR2s/s atria. NaV1.1 which is not expressed in the atrial tissue is not detected.Adapted from King, J.H. et al. (2013) with permission of Elsevier.
Other Applications NaV Antibodies:
Immunocytochemistry:
Expression of NaV1.6 in rat DRG primary cultureImmunocytochemical staining of paraformaldehyde-fixed and permeabilized DRG primary culture. A. Staining using Anti-NaV1.6 (SCN8A) Antibody (#ASC-009), (1:200) followed by goat anti-rabbit-AlexaFluor-555 secondary antibody. B. Nuclear staining using the cell-permeable dye Hoechst 33342. C. Merged image of panels A and B.
Immunocytochemistry:
Expression of NaV1.1 in rat DRG cellsImmunocytochemical staining of Paraformaldehyde-fixed and permeabilized rat dorsal root ganglion (DRG) using Anti-SCN1A (NaV1.1) Antibody (#ASC-001), (1:200), followed by goat anti-rabbit-AlexaFluor-555 secondary antibody. Nuclear staining of cells using the cell-permeable dye Hoechst 33342.
Zhou, C. et al. (2013) J. Biol. Chem. 288, 21458.
Heterozygous knock out of GABA(A) α1 Receptor causes absence epilepsy. The effects of such a knock out were studied in a mouse model of the syndrome. Total and cell surface GABA(A) α3 Receptor increased in cortices from heterozygote GABA(A) α1 receptor knock out animals, as shown in part in immunohistochemical staining using Anti-GABA(A) α3 Receptor (extracellular) Antibody (#AGA-003), (Figure 1). It seems that the increase in receptor level is due to a decrease in endocytosis.
Figure 1. GABA(A) α3 Receptor expression increases in Heterozygous GABA(A) α1 Receptor knock out.Immunohistochemical staining of cortices from wild type (A and C) and Het α1 KO (B and D) mice in layers II/III (A and B) and VI (C and D) of the somatosensory cortex (white scale bar, 20 μm, n > 6) using Anti-GABA(A) α3 Receptor (extracellular) Antibody (#AGA-003). The yellow boxed areas are displayed on a magnified scale below each image (A2–D2).Adapted from Zhou, C. et al. (2013) with permission of the American Society for Biochemistry and Molecular Biology.
Li, J. et al. (2013) J. Neurosci. 33, 3352.
Pacemaker neurons in neonatal spinal nociceptive circuits generate intrinsic burst firing. At physiological membrane potentials, Kir channels were found to reduce conductance in Lamina I pacemaker neurons.
Immunohistochemical staining of rat spinal cord using Anti-Kir2.1 (KCNJ2) Antibody (#APC-026) and Anti-Kir2.3 (KCNJ4) Antibody (#APC-032) shows that both channels are indeed expressed in lamina I pacemaker neurons (Figure 1). The overall results suggest that Kir channels are key modulators of pacemaker activity in newborn central pain networks.
Figure 1. Expression of Kir2.1 and Kir2.3 channels in Lamina I pacemaker cells.Immunohistochemical staining of rat spinal cord sections using Lamina I pacemaker using Anti-Kir2.1 (KCNJ2) Antibody (#APC-026) and Anti-Kir2.3 (KCNJ4) Antibody (#APC-032). Confocal images of representative biocytin-filled pacemaker neurons (red) processed for Kir (green). Merged images demonstrate that immunoreactive puncta for Kir2.1 and Kir2.3 (yellow; inset) are localized to identified pacemaker neurons within lamina I of the neonatal spinal cord (right). Scale bars: 10 μm; inset, 2 μm.Adapted from Li, J. et al. (2013) with permission of The Society for Neuroscience.
Kistler, A.D. et al. (2013) J. Biol. Chem. 288, 36598.
Activating mutations in TRPC6 lead to focal segmental glomerulosclerosis (FSGS). In addition, in some glomerular diseases, TRPC6 expression in podocytes is upregulated.
In an attempt to understand the role of TRPC6 in the pathogenesis of podocyte injury during membranous nephropathy (MN), Kistler, A.D. et al. suggest a dual role for TRPC6 in podocytes: 1- Providing protection from complement-mediated injury. 2- Inducing glomerulosclerosis upon chronic overactivity. Immunohistochemical staining of human MN biopsies, FSGS biopsies and normal kidney tissue with Anti-TRPC6 Antibody (#ACC-017) showed that TRPC6 is most expressed in human MN (Figure 1). Overall, the data suggest that TRPC6 may be a target for the treatment of acquired glomerular diseases like MN.
Figure 1. Expression of TRPC6 in human kidney from MN patients.Immunohistochemical staining of human biopsy specimens from MN patients, FSGS patients, and normal kidney tissue from tumor nephrectomy samples using Anti-TRPC6 Antibody (#ACC-017). TRPC6 expression was below detection levels in control kidneys and only slightly induced in FSGS glomeruli, whereas MN kidneys mostly showed moderate to strong positivity for TRPC6.Adapted from Kistler, A.D. et al. with permission of the American Society for Biochemistry and Molecular Biology.
Suzuki, Y. et al. (2013) J. Biol. Chem. 288, 36750.
The membrane excitability of vascular smooth muscle cells (VSMCs) is determined in part by L-type CaV channels and large conductance KCa channels (BKCa). Caveolin-1 was shown to promote BKCa-CaV1.2 coupling and their clustering to regulate VSMC membrane excitability. Part of the presented data included immunocytochemical staining of mouse mesenteric SMCs using Anti-KCNMA1 (KCa1.1) (1184-1200) Antibody (#APC-107). The colocalization between BKCa and CaV1.2 significantly decreased in Caveolin-1 knockout mesenteric arterial smooth muscle cells (Figure 1).
Figure 1. Expression of BKCa in mouse mesenteric cells. A. Immunocytochemical staining of mouse mesenteric smooth muscle cells. Staining of BKCa using Anti-KCNMA1 (KCa1.1) (1184-1200) Antibody (#APC-107) (green) and CaV1.2 (red) in WT (upper) and Caveolin-1 KO (lower) mice. BKCa and CaV1.2 co-localization is shown in yellow (arrowheads). B. Ratio of BKCa and CaV1.2 co-localization particle number to total BKCa particle number in WT (n = 8) and KO (n = 7) myocytes (*, p < 0.05).Adapted from Suzuki, Y. et al. (2013) with permission of the American Society for Biochemistry and Molecular Biology.
Other Applications for Anti-KCNMA1 (KCa1.1) (1184-1200) Antibody:
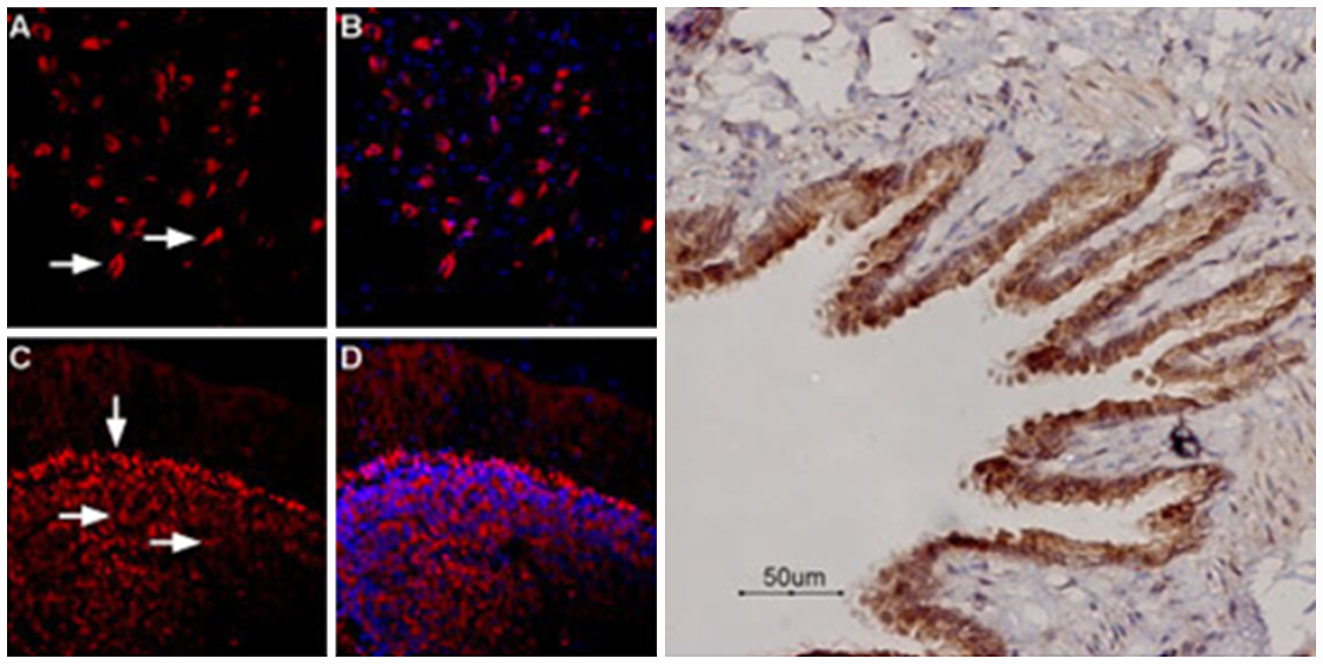
Immunohistochemistry:
Expression of KCa1.1 in rat penisImmunohistochemical staining of rat penis transversal section using Anti-KCNMA1 (KCa1.1) (1184-1200) Antibody (#APC-107). Strong and specific immunostaining is evident in both corpus cavernosum smooth muscle cells (blue arrow) and in the muscular layer of the penis artery (green arrow). Universal Immuno-alkaline-phosphatase Polymer followed by New Fuchsin Subtrate (histofine, Nichirei Corp.) was used for the colour reaction. Hematoxillin is used as the counterstain.
White, C.W. et al. (2013) Proc. Natl. Acad. Sci. U.S.A. 110, 20825.
The generation of double α1A-adrenoceptor and P2X1 receptor knockout mice causes sympathetical blockage of sperm transport through the vas deferens during the emission phase of ejaculation.
Immunohistochemical staining of vas deferens from wild type versus α1A-adrenoceptor and P2X1 receptor double knockout mice shows that P2X1 receptor expression is completely abolished in knockout mice using Alomone Labs Anti-P2X1 Receptor Antibody (#APR-001), (Figure 1). This work shows for the first time that antagonizing both α1A-adrenoceptors and P2X1 receptors leads to a safe and reversible contraceptive method in males.
Figure 1. Expression of P2X1 Receptor in mouse vas deferens.Immunohistochemical staining of mouse vas deferens using Anti-P2X1 Receptor Antibody (#APR-001). A. P2X1 receptor staining (green) is detected in the smooth muscle layer of wild-type vas deferens. B. In double α1A-adrenoceptor and P2X1 receptor knockout mice, there is no detection of P2X1 receptor.Adapted from White, C.W. et al. (2013) with permission of the National Academy of Sciences, USA.
Su, Y.Y. et al. (2013) J. Neurosci. 33, 17884.
Following peripheral inflammation and nerve injury, NaV1.8 accumulates in peripheral nerves. KIF5B, a motor protein, is responsible for the trafficking of NaV1.8 to the plasma membrane following inflammation.
Immunohistochemistry of rat DRG and sciatic nerve using Anti-NaV1.8 Antibody (#ASC-016) demonstrates that NaV1.8 and KIF5B colocalize (Figure 1A). More importantly, fluorescent intensity of both proteins increases in the sciatic nerve four days after inducing inflammation (Figure 1B). In addition, immunoprecipitation studies show that NaV1.8 also physically interacts with the motor protein.
Figure 1. Expression of NaV1.8 in rat DRG and sciatic nerve.Immunohistochemical staining of rat DRG and sciatic nerve using Anti-NaV1.8 Antibody (#ASC-016). A. NaV1.8 (red) and KIF5B co-localize in DRG and sciatic nerve. B. NaV1.8 (red) and KIF5B expression increases following inflammation induction.Adapted from Su, Y.Y. et al. (2013) with permission of the Society for Neuroscience.
Shen, Y. et al. (2013) J. Neurosci. 33, 464.
MC4R is involved in processes of learning and memory function through its interaction with the neuropeptide α-melanocyte-stimulating hormone (α-MSH). Shen et al. show that activation of MC4R enhances synaptic plasticity through the regulation of dendritic spine morphology and abundance of AMPA receptors.
MC4R stimulates GluA1 trafficking through phosphorylation of GluA1. The expression of MC4R in mouse hippocampal neurons was detected in immunocytochemical staining using Anti-MC4 Receptor (extracellular) Antibody (#AMR-024) (Figure 1A). In addition, the essential role MCR4 regarding synaptic functionality was demonstrated by treating hippocampal neurons with MCR4 targeted shRNA. The efficiency of shRNA treatment was observed in western blot analysis using Anti-Melanocortin Receptor 4 (extracellular) Antibody in HEK293 cells transfected with MC4R expression construct (Figure 1B). Knocking down MCR4 significantly reduced dendritic spine density and the percentage of mature spines.
Figure 1. Expression of MC4R in mouse hippocampal neurons.A. Immunocytochemical staining of mouse hippocampal neurons. Extracellular staining of cells using Anti-MC4 Receptor (extracellular) Antibody (#AMR-024) (green). B. Western blot analysis of MC4R-transfected HEK 293 cells treated with and with shRNA targeting MC4R. shRNA treatment decreased the receptor level by 83%. MC4R protein levels were detected with Anti-Melanodortin Receptor 4 (extracellular) Antibody.Adapted from Shen, Y. et al. (2013) with permission of the Society for Neuroscience.
Other Applications for Anti-Melanocortin Receptor 4 (extracellular) Antibody:
Live cell imaging:
Expression of MC4R in living rat pituitary cell lineImmunocytochemical staining of live intact GH3 cells with Anti-MC4 Receptor (extracellular) Antibody (#AMR-024), (1:50). A. MC4R staining was observed, followed by Alexa-555-conjugated goat anti-rabbit secondary antibody (red staining). Hoechst 33342 (blue) is used to visualize the nuclei. B. Live view of the same field as A.
Immunohistochemistry:
Expression of MC4R in mouse brainImmunohistochemical staining of perfusion-fixed frozen mouse brain sections using Anti-MC4 Receptor (extracellular) Antibody (#AMR-024), (1:100). MC4R (green fluorescence) is expressed in the mouse hypothalamus in axonal processes (arrows). Hoechst 33342 is used as the counterstain (blue).
Hargus, N.J. et al. (2013) J. Neurophysiol. 110, 1144.
During epileptogenesis, a series of molecular and cellular events ultimately lead to an increase in neuronal excitability, which in turn initiates epileptic seizures.
Expression of NaV1.6 channel was shown to increase during epileptogenesis in layer II neurons from the medial entorhinal cortex (mEC). Immunohistochemical staining of rat mECs using Anti-SCN1A (NaV1.1) Antibody (#ASC-001), Anti-NaV1.2 Antibody (#ASC-002), Anti-NaV1.3 Antibody (#ASC-004) and Anti-NaV1.6 (SCN8A) Antibody (#ASC-009), showed that only NaV1.6 expressed at axonal initial segments (AIS, the site of action potential firing), is significantly increased during epileptogenesis (Figure 1). NaV1.2 expression also increased during epileptogenesis, but its expression was not detected in AIS. This study suggests a significant role for NaV1.6 in mECs during epileptogenesis, since blocking the channel suppressed neuronal hyperexcitability.
Figure 1. Expression of NaV1.6 increases in rat mECs during epileptogenesis.A. Immunohistochemical of rat mECs using Anti-NaV1.6 (SCN8A) Antibody (#ASC-009). NaV1.6 staining is detected in AIS and increases in post-SE tissue. The channel co-localizes with Ankryn-G, a marker of AIS. B. Ratio of post-SE and control tissues shows that NaV1.6 expression increases by 46%. C. Somatal expression for NaV1.6 and NaV1.2 (using Anti-NaV1.2 Antibody (#ASC-002)). D. Normalized expression of the channel expression shows that both NaV1.2 and NaV1.6 expression increases in the soma of post-SE tissues. NaV1.1 and NaV1.3 expression, detected using Anti-SCN1A (NaV1.1) Antibody (#ASC-001) and Anti-NaV1.3 Antibody (#ASC-004), respectively, does not change during epileptogenesis.Adapted from Hargus, N.J. et al. (2013) with permission of the American Physiological Society.
Other Applications for Anti-NaV1.6 (SCN8A) Antibody:
Immunocytochemistry:
Expression of NaV1.6 in rat DRG primary cultureImmunocytochemical staining of paraformaldehyde-fixed and permeabilized DRG primary culture. A. Staining using Anti-NaV1.6 (SCN8A) Antibody (#ASC-009), (1:200) followed by goat anti-rabbit-AlexaFluor-555 secondary antibody. B. Nuclear staining using the cell-permeable dye Hoechst 33342. C. Merged image of panels A and B.
Wang, H. et al. (2013) Proc. Natl. Acad. Sci. U.S.A. 110, 19336.
Matrix elasticity regulates proliferation, apoptosis and differentiation of many cell types across various tissues. Valvular fibroblasts sense the changes in matrix elasticity through the PI3K/AKT pathway. This mechanism may be used by other mechano-sensitive cells. Preliminary experiments aimed at identifying proteins responsible for transmitting matrix elasticity show that treating cells with Alomone Labs GsMTx-4 (#STG-100), an inhibitor of mechano-sensitive ion channels (ex. TRPC6) reduces valvular myofibroblast differentiation under certain growth conditions (Figure 1).
Figure 1. Inhibiting mechano-sensitive ion channels reduces valvular myofibroblast differentiation.Immunocytochemical staining of VICs treated with the mechano-sensitve ion channel inhibitor GsMTX (#STG-100) at 5 μM. αSMA protein expression was reduced relative to the internal control, GAPDH (not shown). Similarly, αSMA stress fibers (green) were inhibited by the inhibitor. Nuclei, blue. (Scale bars, 100 μm.).Adapted from Wang, H. et al. (2013) with permission of the National Academy of Sciences, USA.
Yoshida, T. et al. (2013) J. Biol. Chem. 288, 23823.
Cachexia, is weight and muscle loss which occurs as a result of chronic diseases such as cancer, congestive heart failure which may be triggered by angiotensin II (Ang II).
Yoshida, T. et al. (2013) show that Ang II acts directly on satellite cells (important for muscle regeneration) via Angiotensin receptor type 1 (AT1R), to prevent their proliferation and muscle regeneration. AT1R expression was detected on satellite cells via indirect flow cytometry and immunocytochemical staining of intact cultured mouse myofibers using Anti-Angiotensin II Receptor Type-1 (extracellular) Antibody (#AAR-011) (Figure 1).
Figure 1. Expression of AT1R in mouse satellite cells and mouse myofibers.A. Indirect flow cytometry of mouse satellite cells using Anti-Angiotensin II Receptor Type-1 (extracellular) Antibody (#AAR-011). B. Immunocytochemical staining of intact cultured mouse myofibers using same antibody as in A.Adapted from Yoshida, T. et al. (2013) with permission of the American Society for Biochemistry and Molecular Biology.
Other applications for Anti-Angiotensin II Receptor Type-1 (extracellular) Antibody:
Immunohistochemistry:
Expression of Angiotensin II Receptor Type-1 in mouse cerebellumImmunohistochemical staining of mouse cerebellum using Anti-Angiotensin II Receptor Type-1 (extracellular) Antibody (#AAR-011). A. Mouse anti-Parvalbumin (red) is detected in the Purkinje layer. B. In the same section, AT1 receptor (green) is also present in the Purkinje layer. Arrows point at AT1 receptor immunoreactive cells. Merge of A and B pannels reveals partial co-localization.
Bhattacharya, A. et al. (2013) J. Neurosci. 33, 8035.
In SCN cell culture, P2X2R immunoreactivity dected with Anti-P2X2 Receptor Antibody (#APR-003) colocalized with the presynaptic marker synapsin I. Not all the terminals labeled by the synapsin I antibody were positive for P2X2R.
Overall, the work shows that P2X receptors, namely P2X2, form an excitatory system important for regulating the electrical activity of circadian pacemaker cells.
Figure 1. Expression of P2X2 receptor in rat SCN.Immunocytochemical staining of rat suprachiasmatic nuclei (SCN) cell culture. Fixed and permeabilized cells were stained using Anti-P2X2 Receptor Antibody (#APR-003). P2X2 immunoreactivity (red) is observed in punctate structures in the SCN cell culture. Arrowheads indicate example structures that are double-labeled with P2X2R and synapsin I (green). Dapi is used to label cell nuclei. Scale bar, 20 μm.Adapted from Bhattacharya, A. et al. (2013) with permission of The Society for Neuroscience.
Other applications for Anti-P2X2 Receptor Antibody:
Immunohistochemistry:
Expression of P2X2 Receptor in rat neocortexImmunohistochemical staining of rat neocortex with Anti-P2X2 Receptor Antibody (#APR-003). P2X2 Receptor (green) appears in axonal processes (arrows) that ascend toward the upper cortical layers (asterisk). DAPI is used as the counterstain (blue).
Expression of P2X2 Receptor in rat hippocampus
Immunohistochemical staining of rat hippocampus with Anti-P2X2 Receptor Antibody (#APR-003). P2X2 Receptor (green) appears in the apical dendrites (arrows) that extend into the striatum radiatum (asterisk). DAPI is used as the counterstain (blue).
Choi, R.C. et al. (2013) Mol. Pharmacol. 84, 50.
This paper shows that P2Y2 activation in rat cultured cortical neurons induces cholinergic gene expression. Expression of the GPCR was demonstrated using Anti-P2Y2 Receptor Antibody (#APR-010).
Immunocytochemical staining of rat cultured cortical neurons using Anti-P2Y2 Receptor Antibody (#APR-010) shows that P2Y2 is located in synapses and partly colocalizes with PSD-95, a postsynaptic marker (Figure 1.). This study shows that activation of P2Y2 has a developmental role in cells.
Figure 1. Synaptic expression of P2Y2 receptor.Immunocytochemical staining of rat cortical neurons. Staining using Anti-P2Y2 Receptor Antibody (#APR-010). P2Y2 (green) is detected in synapses and partially colocalizes with the postsynaptic marker PSD-95.Adapted from Choi, R.C. et al. (2013) with permission of the American Society for Pharmacology & Experimental Therapeutics.
Feng, S. et al. (2013) Proc. Natl. Acad. Sci. U.S.A. 110, 11011.
TRPC3 channel was shown to be an important component in regulating Ca2+ uptake and Ca2+ homeostasis in mitochondria. Its role was demonstrated using Anti-TRPC3 Antibody (#ACC-016) in western blot analysis and immunohistochemical staining.
Western blot analysis on purified mitochondria from rat liver and brain using Alomone Labs Anti-TRPC3 Antibody (#ACC-016) demonstrated substantial presence of TRPC3. Blotting with Anti-TRPC1 Antibody (#ACC-010) and Anti-TRPC6 Antibody (#ACC-017) could not detect TRPC1 and TRPC6 respectively. Complementary experiments on Trpc3-/- versus wild type (WT) mice verified the specificity of these antibodies and showed that other TRPC channels' expression levels are not changed in Trpc3-/-. Importantly, immunohistochemical staining of mouse cerebellum showed loss of TRPC3 signal in Trpc3-/- mice (Figure 1. upper panel). Immunoelectron microscopy using Anti-TRPC3 antibody on mouse cerebella showed that gold particles were found on the inner mitochondrial membrane of WT, but not Trpc3−/−, cerebella (Figure 1. lower panel). In conclusion, this work provides ample evidence to the importance of TRPC3 in regulating mitochondrial Ca2+homeostasis. Further research should be made to determine the exact pathways involved in Ca2+ signaling mediated by TRPC3 in the mitochondria.
Figure 1. Expression of TRPC3 in mouse cerebella mitochondria.Immunohistochemical staining of cerebella from WT mice (upper panels) and Trpc3-/- mice (lower panel) using Anti-TRPC3 Antibody (#ACC-016), (green). Electron microscopy of immunogold labeling by Anti-TRPC3 antibody of mitochondrial inner membranes (red arrows) of the cerebellum from WT, but not Trpc3−/− mice.Adapted from Feng, S. et al. (2013) with permission of National Academy of Sciences, USA.
Other applications for Anti-TRPC3 Antibody:
Immunocytochemistry:
Expression of TRPC3 in rat C6 brain glioma cellsImmunocytochemical staining of Paraformaldehyde-fixed and permeabilized rat C6 brain glioma cells. A. Staining using Anti-TRPC3 Antibody (#ACC-016), (1:500) followed by goat anti-rabbit-AlexaFluor-488 secondary antibody. B. Nuclear staining using the cell-permeable dye Hoechst 33342. C. Merged image of panels A and B.
Pribiag, H. and Stellwagen, D. (2013) J. Neurosci. 33, 15879.
TNF-α expression significantly increases in response to inflammatory neurological stress, infection and neurodegenerative diseases. As a result, neurons rapidly increase excitatory synaptic strength. Elevated excitatory synaptic strength occurs as a result of decreased GABAergic neurotransmission in hippocampal neurons via TNF-α.
Mechanistically, exposure of hippocampal neurons to TNF-α leads to a decrease in cell surface levels of GABA(A) receptors as shown in live cell imaging of rat hippocampal neurons. Immunocytochemical staining of live cells was done in part using Alomone Labs Anti-GABA(A) α1 Receptor (extracellular) Antibody (#AGA-001) and Anti-GABA(A) γ2 Receptor (extracellular) Antibody (#AGA-005). Indeed, Figure 1 shows a rapid downregulation of GABA(A) γ2 Receptor levels at the cell surface ten minutes post TNF-α treatment, which continue to decrease three hours after treatment. Decreased GABA(A) receptor levels occur via the activation of p38 MAPK, PI3-kinase, protein phosphatase 1 and dynamin GTPase as a result of TNFR1 activation by TNF-α.
Figure 1. TNF-α-induced downregulation of surface GABA(A) γ2 Receptor.Immunocytochemical staining of rat living hippocampal neurons. A. Extracellular staining of cells using Anti-GABA(A) γ2 Receptor (extracellular) Antibody (#AGA-005), (1:100). Representative images from time course experiments with cultured neurons undergoing TNF-α treatment ranging from 10 min to 6 h in duration. Results show a rapid downregulation in surface levels of the γ2 subunit in response to TNF-α. B. Quantification data of surface γ2 cluster area, over the 6 h time course of TNF-α treatment (n = 120 –158 images per time point; one-way ANOVA, Tukey’s post hoc test, **p < 0.01, ***p < 0.001).Adapted from Pribiag, H. and Stellwagen, D. (2013) with permission of the Society for Neuroscience.
These important findings provide a link between inflammatory aspects of neurological diseases and a lack of GABAergic neurotransmission.
Other applications for Anti-GABA(A) α1 Receptor (extracellular) Antibody:
Immunohistochemistry:
Expression of GABA(A) α1 Receptor in mouse hippocampusImmunohistochemical staining of GABA (A) α1 Receptor in mouse hippocampus using Anti-GABA (A) α1 Receptor (extracellular) Antibody (#AGA-001). A. Distribution of GABA (A) α1 Receptor (red) in mouse hippocampus. B. Distribution of glial fibrillary acidic protein (green). C. Merge of the two images indicates that distribution of GABA (A) α1 Receptor is restricted to neurons and their processes. DAPI is used as the counterstain (blue).
Colocalization of CaV1.2 and GABA(A) α1 Receptor in rat cerebellum
Immunohistochemical staining of rat cerebellum using Guinea pig Anti-CaV1.2 Antibody (#AGP-001) and Anti-GABA(A) α1 Receptor (extracellular) Antibody (#AGA-001). A. CaV1.2 (green) is detected in the granule layer of the cerebellum (G) and in the upper molecular layer (star). B. In the same section, GABA(A) α1 Receptor (red) is seen in the granule layer. C. Merge of the two images reveals high degree of colocalization between CaV1.2 and GABA(A) α1 Receptor in the granule layer.
Cuddapah, V.A. et al. (2013) J. Neurosci. 33, 1427.
This paper focuses on the expression and co-localization of CLC-3 and KCa3.1 channels in human gliomas using Anti-CLC-3 Antibody (#ACL-001) and Mouse Anti-KCNN4 (KCa3.1, SK4) (extracellular) Antibody (#ALM-051). It appears that the channels may also play a role in the migration of gliomas.
Malignant transformation of glial cells gives rise to gliomas which are prominently known for their enhanced proliferation and angiogenesis, and more so by their extreme ability to migrate. Their migration and invasiveness into non-affected brain areas leads to masses with poorly defined boundaries. The development of drugs to reduce disease spreading relies on the understanding of the mechanisms leading to cell migration of these cell types. Immunocytochemical staining of D54 human glioma cells using Alomone Labs Mouse Anti-KCNN4 (KCa3.1, SK4) (extracellular) Antibody (#ALM-051) shows that SK4, CLC-3 and Bradykinin B2 receptor (B2R) all colocalize to the leading edges of glioma cells (Figure 1). The screening of seven different human glioma cell lines by western blot analysis shows that all tested cell lines express CLC-3 (using Anti-CLC-3 Antibody (#ACL-001)) and B2R and 6/7 cell lines express KCa3.1 channels suggesting that the mechanism of migration a general one adopted by different gliomas.
Figure 1. Colocalization and expression of KCa3.1, ClC-3 and B2R in glioma cells.A-C. Immunocytochemical staining of human D54 glioma cells using Mouse Anti-KCNN4 (KCa3.1, SK4) (extracellular) Antibody (#ALM-051). KCa3.1, ClC-3 and B2R co-localize to the edges of cells. D. Western blot analysis of a number of glioma cells using Anti-CLC-3 Antibody (#ACL-001) and Mouse Anti-KCNN4 (KCa3.1, SK4) (extracellular) Antibody.Adapted from Cuddapah, V.A. et al. (2013) with permission of the Society for Neuroscience.
Additional applications for Mouse Anti-KCNN4 (KCa3.1, SK4) (extracellular) Antibody:
Live cell imaging:
Expression of KCa3.1 in live intact human LN-CaP prostate carcinoma cellsImmunocytochemical staining of live intact human LN-CaP prostate carcinoma cells. A. Extracellular staining of cells with Mouse Anti-KCNN4 (KCa3.1, SK4) (extracellular) Antibody (#ALM-051), (1:20), followed by goat-anti-mouse-DyLight-594 secondary antibody (red). B. Live view of the cells. C. Merge of the two images.
Indirect flow cytometry:
Indirect flow cytometry analysis of live intact Raji (human Burkitt's lymphoma B-cell) cell line:___ Cells + goat-anti-mouse-Cy5.___ Cells + mouse IgM isotype control + goat-anti-mouse-Cy5.___ Cells + Mouse Anti-KCNN4 (KCa3.1, SK4) (extracellular) Antibody (#ALM-051), (1:20) + goat-anti-mouse-Cy5.
Indirect flow cytometry analysis of live intact THP-1 (human acute monocytic leukemia cells) cell line:___ Cells + Goat-anti-mouse-Cy5.
___ Cells + Mouse IgM isotype control+ Goat-anti-mouse-Cy5.
___ Cells + Mouse Anti-KCNN4 (KCa3.1, SK4) (extracellular) Antibody (#ALM-051), (1:20) + Goat-anti-mouse-Cy5.
Birbrair, A. et al. (2013) Exp. Cell Res. 319, 45.
Damaged nerve tissue can be regenerated by grafting neural precursor cells, but this involves numerous ethical and histocompatibility issues. One possibility to obtain neural precursor cells is to get stem cells, other than from the central nervous system, that are capable of undergoing neural differentiation. Neural progenitor cells from skeletal muscle cultures could be isolated. These cells express features that are characteristic of NG2-glia, including the expression of the Kir6.1 inward rectifier K+ channel detected in immunocytochemical staining using Alomone Labs Anti-Kir6.1 Antibody (#APC-105).
Mamenko, M. et al. (2013) J. Biol. Chem. 288, 2036.
This paper focuses on TRPV4 activation by both PKA and PKC. PKA affects the subcellular localization of the channel as shown using Anti-TRPV4 Antibody (#ACC-034), while PKC influences the activity.
TRPV4 channel is expressed in distal nephron cells where it mediates cellular Ca2+ responses to elevated luminal flow. Both PKA and PKC were tested for their possible role in regulating the activity of the channel. Indeed, PKC was found to regulate the activity of TRPV4, while PKA regulates the subcellular localization of the channel. Immunocytochemical staining of split-opened murine distal nephrons using Alomone Labs Anti-TRPV4 Antibody (#ACC-034) shows that activation of PKA by forskolin causes TRPV4 translocation to the apical plasma membrane, an effect which is blocked by a specific PKA inhibitor (Figure 1). On the other hand, activation of PKC with PMA was shown to significantly increase [Ca2+]i responses to flow without affecting the subcellular distribution of the channel. The synergistic activation of TRPV4 by both PKA and PKC enables to manipulate the [Ca2+]i levels and the magnitude of [Ca2+]i responses to changes in tubular flow.
Figure 1. PKA activation causes TRPV4 subcellular translocation.Immunocytochemical staining of TRPV4 expression in split-opened nephrons using Anti-TRPV4 Antibody (#ACC-034). A. control conditions. B. Activation of PKA with forskolin leads to TRPV4 translocation to the apical plasma membrane. C. Activation of PKC with PMA has no effect. D. pre-treatment with PKA specific inhibitor, abolishes TRPV4 translocation.Adapted from Mamenko, M. et al. (2013) with permission of American Society for Biochemistry and Molecular Biology.
Apolloni, S. et al. (2013) Hum. Mol. Genet. 22, 4102.
A number of factors are believed to be the cause of non-inherited (or sporadic) amyotrophic lateral sclerosis (ALS), a neurodegenerative disease fatal to motoneurons of the spinal cord. However, missense mutations in the gene encoding superoxide dismutase 1 (SOD1), an enzyme specialized in eliminating free superoxide radicals are the cause for a rare inherited form of familial ALS (fALS). Both transgenic mice with over-expressed mutated SOD1 (SOD1-G93A) and ALS patients, seem to undergo a harsh inflammatory crisis driven by activated microglia in response to toxic pathogens; a reaction which usually results in loss of motoneurons.
ATP-activated P2X7 receptor, which is mainly expressed in microglial cells of SOD1-G93A mice spinal cord, seems to play a crucial role in promoting escalation of the microglia-dependent inflammation. In order to assess the influence of P2X7 receptor in the development of ALS, Apolloni et al. compared SOD1-G93A mice with hetero- and homozygous P2X7 receptor knock-out (KO) SOD1-G93A and wild type (WT) mice.
First, using Anti-P2X7 Receptor-ATTO Fluor-550 Antibody (#APR-004-AO) and Anti-P2X7 Receptor Antibody (#APR-004), the investigators performed immunohistochemistry and western blot analysis on lumbar spinal cord sections of both SOD1-G93A and P2X7 double KO mice, in order to characterize the expression levels of P2X7 receptor. As anticipated, P2X7 was detected in microglia cells of SOD1-G93A mice (Figure 1A). Moreover, P2X7 levels in lumbar spinal cord protein lysates from P2X7+/- mice were reduced to half, compared with WT, and were completely absent in P2X7-/- samples (Figure 1B).
Figure 1. Expression of P2X7 receptor in mouse spinal cord.A. Immunohistochemical staining of mouse spinal cord sections (L3–L5) from SOD1-G93A mice were double-immunostained either with anti-Iba-1, NeuN or GFAP (green) and Anti-P2X7 Receptor-ATTO Fluor-550 Antibody (#APR-004-AO), (red). P2X7 is present only in microglia cells as shown in the merged panel (yellow). Scale bar = 20 μm, insets = 50 μm. B. Western blot analysis of mouse total lumbar spinal cord lysates (L3–L5) from WT, P2X7+/-and P2X7-/- 90-day-old mice using Anti-P2X7 Receptor Antibody (#APR-004).Adapted from Apolloni, S. et al. (2013) with permission of Oxford University Press.
Interestingly, behavioral tests showed that although ALS-related performance debilitation was markedly aggravated in P2X7-/-/SOD1-G93A mice with respect to SOD1-G93A mice, double KO mice females had a survival rate significantly higher from SOD1-G93A mice females.
This work adds a solid layer of understanding to the involvement of P2X7 in neuroinflammatory mechanisms and neurodegenaration of motoneurons in lumbar spinal cords of ALS model mice.
Corbett, B.F. et al. (2013) J. Neurosci. 33, 7020.
This paper focuses deals with the cleavage of NaVβ2 via BACE-1 (Beta-site APP-cleaving enzyme 1), leading to increased NaV1.1 levels, which do not translocate to the cell plasma membrane. Reinforcing that decreased NaV1.1 levels are involved in AD development/progression. This work cites the use of Alomone Labs Anti-SCN1A (NaV1.1) Antibody (#ASC-001) and Anti-NaVβ2 Antibody (#ASC-007).
The early stages of Alzheimer's disease (AD), an incurable neurological affliction with adverse effects on memory and cognition, are often accompanied by aberrant neuronal activity and epileptic seizures - events which are increasingly seen as having a direct influence on AD's progression. Cortical accumulation of amyloid β (Aβ), a peptide derived from amyloid precursor protein (APP), seems to play a prominent role on the onset of AD. Beta-site APP-cleaving enzyme 1 (BACE1) – the rate-determining factor in Aβ synthesis – is significantly high in both AD patients and APP mice (transgenic line with over-expresses human APP that models AD). In AD patients, BACE1 is strongly associated with β2-subunit of voltage gated Na+ channel (NaVβ2) cleavage that detaches the channel's C-terminal fragment (CTF). In this scenario, subsequent cleaving of NaVβ2-CTF releases the intracellular domain (ICD) of NaVβ2, which migrates to the nucleus and enhances the expression of Na+ voltage-gated 1.1 (NaV1.1) pore forming subunit (NaV1.1α). NaV1.1, now in excess, fails to translocate to the cell surface. Functional NaV1.1 levels are thus reduced and neuronal activity is compromised. Whether APP mice are also prone to BACE1 cleavage operation is the subject matter for this Paper of the Week. Using Alomone Labs Anti-NaVβ2 Antibody (#ASC-007) and Anti-SCN1A (NaV1.1) Antibody (#ASC-001), Corbett et al. performed western blot analyses on cortical lysates of APP (and wild-type) mice and found, a significant increase of both NaVβ2-CTF and NaV1.1 (the latter was later shown, via biotinylation, to reside mainly in hippocampal intracellular islets, rather than on cells surfaces, rendering the channel non-functional), when compared to wild-type (WT) mice, in accordance with BACE1's cleavage theorem. Additionally, in Morris water-maze tests, the more functional NaV1.1 a mouse had, the higher it scored (i.e., it spent less time idle) and vice versa. Next, Anti-NaVβ2 was used in immunohistochemical staining of mouse cortical slices. Anti-NaVβ2 recognized the C-terminal region of NaVβ2 which corresponds to the ICD region that triggers excessive expression of NaV1.1. The group's results revealed that cortices of APP mice contain NaVβ2-rich nuclei, of both GABAergic and glutamatergic neurons (Figure 1). Finally, they evaluated electroencephalograph (EEG) recordings of the AD susceptible mice. The longer high-frequency activity together with spike-wave discharges and irregular EEG patterns suggest abnormal neuronal activity which correlates well with epileptiform events.
Figure 1. Increased NaVβ2-positive nuclei in cortex of APP mice.A. APP mice exhibit increased numbers of NaVβ2-positive nuclei in cortical regions (arrows). B. Quantification of nuclear NaVβ2 staining in APP and NTG mice, n = 7-9/genotype. C, Quantification of NaVβ2 staining in brain sections from PSAPP mice reveals a significant increase in NaVβ2-positive nuclei also in this mouse model, n 5-7/genotype. D. E. Double-labeling of NaVβ2 and GAD67 in brain sections from APP mice. Confocal images of NaVβ2 and GAD67 immunostaining demonstrate that some NaVβ2-positive nuclei are found in cells that also express GAD67 (D. arrowheads), but others do not express GAD67 (E. arrows). *p>0.05, ***p>0.001.Adapted Corbett, B.F. et al. (2013) with permission of the Society for Neuroscience.
To summarize, this work demonstrates the cellular mechanism behind asynchronous neuronal firings in AD, and emphasizes the role of BACE1, acting on NaVβ2 to reduce NaV1.1 in AD pathophysiology.
Barry, J. et al. (2013) J. Cell Sci. 126, 2027.
Membrane proteins of somata origin, destined to remote axonal locations, are carried anterogradely by vesicles, across cytoskeletal microtubules, via specialized kinesin-1 motor complexes. KIF5B, a mammalian kinesin-1 heavy chain dimer present in clusters across neurons, serves as a transportation vehicle for these vesicles; it rides along microtubules with its N-terminal motor domain, while its C-terminal tail – consisting of two kinesin light chains (KLCs) - binds cargo vesicles directed to specific, distant sites.
KV3.1 (Shaw voltage-gated K+) channel, the primary KIF5B-binding channel and a member of the KV channel proteins (which are abundant in axons and regulate various physiological events - from action potential initiation to neurotransmitter release), is involved in fast spiking and is highly expressed in cerebellar granule cells. It is comprised of four voltage sensing and pore forming α subunits, each includes six membrane spanning domains and intracellular terminals; its N-terminal domain stabilizes the channel and forms a functional tetramer with the tail of a KIF5B unit.
Pull-down assays, performed by Barry et al. reveal in this Paper of the Week three basic residues (R, K, and R, at positions 892, 893, and 894, respectively) in a 70 residue KIF5B tail site (T70) critical for KV3.1 binding, which can be bound simultaneously in groups of up to four units by a single KV3.1 complex. Interestingly, in vitro competition assays showed that KV3.1 competes with the motor unit and microtubules, but not with KLCs - present in the tail domain - suggesting a role for KV3.1 in activating KIF5B motors. Further, surface plasmon resonance (SPR) experiments determined that KV3.1 binds T70 with high affinity, and has fast association, and slow dissociation rates (Kd: ~6.0 M, Kon: ~2.7 M, and Koff: ~1.6 M, respectively).
Next, using Alomone Labs Anti-KV3.1b (KCNC1) Antibody (#APC-014), the authors conducted a set of immunocytochemistry experiments designed to assess the influence of KV3.1 and other proteins on the distribution pattern of KIF5B in cultured hippocampal neurons at 21 days in vitro (DIV). Not surprisingly, KV3.1 co-localized in clusters with wild-type KIF5B throughout the axon and the soma (Figure 1), whereas mutant KIF5B tail (T70RKR) failed to effectively bind KV3.1. Successive co-transfection trials further concluded that KV3.1 clusters WT KIF5Bs along neurons while KLCs tend to disperse them.
Figure 1. Co-localization of KV3.1b and KIF5 in Rat Hippocampal NeuronsImmunocytochemical staining of rat hippocampal neurons with Anti-KV3.1b (KCNC1) Antibody (APC-014) and anti-KIF5 antibody. Arrows in right panel depict colocalization between the two proteins.Adapted from Barry, J. et al. (2013) with permission of The Company of Biologists LTD.
Lastly, the group explored the distribution pattern of KIF5B in KV3.1 knock-out (KO) mice. Western blot assays with Anti-KV3.1b (KCNC1) Antibody clearly showed total elimination of KV3.1, while the expression of KIF5B and its associated proteins remained unchanged. Consistently, in coronal sections of the cerebellum of KV3.1 KO mice immunostained with Anti-KV3.1b (KCNC1) Antibody, KV3.1 signals were sparse, and clusters of KIF5B, which had levels comparable to WT results, were reduced dramatically.
In summary, this work greatly illuminates the mechanisms behind anterograde neuronal transportation and highlights the role of KV3.1 in binding, clustering and directing KIF5B motor proteins.
Housley, G.D. et al. (2013) Proc. Natl. Acad. U.S.A. 110, 7494.
The mammalian auditory system demonstrates a remarkable sensitivity over a wide acoustic range and has the capacity to tolerate sound at pressures of up to ~120 dB. However, the sense of hearing is faced with occasional threats posed by personal and industrial sound-emitting devices which overwhelm the hearing organ with acoustic levels reaching its power threshold and beyond. Interestingly, the ear is equipped with otoprotective, purinergic adaptation mechanism. Activated P2X2Rs - ATP-dependent nonselective cation receptors expressed abundantly in cochlear lining cells such as sensory hair cells of the organ of Corti, Reissner’s epithelial cells and spiral ganglion neurons - reduce substantially both the endocochlear and hair-cells membrane potential of the inner ear in response to elevated sound floor following discharge of ATP molecules. This results in temporary threshold shift (TTS) which compromises hearing resolution for hours to days.
As was shown by Housley et al., exposure of P2X2 knockout (KO) mice (P2RX2-null) to high octave band noise of 85 dB for 30 minutes failed to confer TTS and had no influence on distortion product otoacoustic emissions (DPOAEs; indicating outer hair cell function and cochlear micromechanics) thresholds at baseline values. In contrast, the same acoustic paradigm hastened the occurrence of TTS in WT mice, as well as elevated their DPOAEs thresholds - both significantly when compared to the KO group.
Subsequent increase of the sound pressure to 95 dB caused WT mice to develop transient hearing loss which lacked a shift in DPOAEs threshold, whereas P2RX2-null mice acquired permanent threshold shift (PTS) and an acute DPOAEs upward shift. Histological cross sections of mice stimulated for two hours with 100 dB, 8-16 kHz band-pass noise that induced PTS in WT albeit considerably lower than that of P2RX2-null mice, showed notable atrophy of spiral ganglion neurons and reduction of midcochlear-region’s somata size in the KO group, although no significant change in neuronal density and hair cell count was observed between the two groups. This finding suggests that PTS is the outcome of neuronal injury rather than hair-cell loss.
Further histological assays with using Alomone Labs Anti-P2X2 Receptor Antibody (#APR-003), validated that P2X2 expression is largely restricted to the cochlear partition in WT and absent in P2RX2-null mice. Consistent with these data, all WT ATP-activated Reissner’s membrane, inner hair cells, or outer hair cells analyzed with patch-clamp procedures, were responsive and had a mean inward current that ranged from -2.06 nA to -304 pA, while matched cells from P2RX2-null mice were altogether unresponsive.
This study therefore sheds invaluable insight on both the functionality of the P2X2 receptor in adaptive hearing protection and its expression sites, thus opens a gateway for further analyses of sound-induced P2X2-signaling which underlie various hearing pathologies.
Weisbrod, D. et al. (2013) Proc. Natl. Acad. Sci. U.S.A. 110, E1685.
During early embryonic stages, cardiomyocyte pacemaker activity is a significant contributor. However, in the developed heart, the pacemaker activity is only detected in sinoatrial node (SAN) cells, the atroventricular node and the bundle of HIS. The remaining cardiac cells are granted with a rhythmic automaticity which depends on a voltage and Ca2+ clock.
The voltage clock is described as the overall currents provided by the pacemaker If current, L-type and T-type Ca2+ currents. The Ca2+ clock, suggested to be a Ca2+-dependent pacemaker mechanism is derived by the Ca2+ release from the sarcoplasmic reticulum, important for the SAN pacemaker activity. The Ca2+ clock is also important for the activation of the Na+-Ca2+ exchanger (NCX) required for the diastole. Yet, these mechanisms remain to date controversial. In the presented work, human embryonic stem cell-derived cardiomyocytes (hESC-CMs) were used to study the pacemaker mechanisms of the embryonic heart development. The study showed that hES-CMs are heterogenic such that they have three pacemaker phenotypes: If-dependent, If-independent and a combination of both. However, following treatment with blockers targeting If, NCX or ryanodine receptors, all three phenotypes displayed the same depolarizing drift of the maximal diastolic potential (MDP), suggesting that a common pacemaker component must be involved. Indeed, KCa3.1 (SK4, IKCa1, KCNN4) detected in immunocytochemistry and western blot analysis using Mouse Anti-KCNN4 (KCa3.1, SK4) (extracellular) Antibody (#ALM-051) was found to be the common denominator for all three phenotypes. Western blot analysis of hESC-CM lysates also detected the expression of HCN2, HCN4 and CaV1.3 channels using Anti-HCN2 Antibody (#APC-030), Anti-HCN4 Antibody (#APC-052) and Anti-CaV1.3 (CACNA1D) Antibody (#ACC-005), respectively. KCa3.1 identity was also found in electrophysiological studies using KCa3.1 blockers. Importantly, blocking KCa3.1 completely abolished the pacemaker activity in hESC-CMs, thereby suppressing the automaticity. Its presence was reinforced by ruling out the involvement of other Ca2+-activated K+ channels by using Alomone Labs Iberiotoxin (STI-400), a blocker of BK channels and the small conductance blocker Apamin (STA-200). This elegant and thorough work sets the ground for a new pacemaker target, SK4, in cardiac rhythm disorders.
Figure 1. SK4 (KCa3.1) Channel is expressed in hESC-CMsImmunocytochemical staining of hESC-CMs. Cells were stained with Mouse Anti-KCNN4 (KCa3.1, SK4) (extracellular) Antibody (#ALM-051) followed by anti-mouse-Dylight405 secondary antibody (green). α-Actinin staining was used as a control (red). Upper panels are 18 days old beating clusters. Lower panels are dissociated hESC-CMs.Adapted from Weisbrod, D. et al. (2013) Proc. Natl. Acad. Sci. U.S.A. 110, E1685. with permission of the National Academy of Sciences.
Hayashi, T. et al. (2013) J. Clin. Invest. 123, 272.
Parkinson’s disease is primarily characterized by a loss of dopaminergic neurons. Cell-based replacement of those neurons is a major objective in treating this debilitating neurodegenerative disease. Autologous transplantation of differentiated mesenchymal stem cells (MSC-DP) led to long-term survival and restoration of motor function in parkinsonian macaques. The differentiated MSC cells (to A9 subtype dopaminergic neurons) expressed the following markers: β tubulin, microtubule-associated protein 2 (MAP-2), tyrosine hydroxylase (TH), dopamine transporter (DAT), forkhead box protein A2 (FOXA2) and G protein-activated inward rectifier K+channel 2 (Kir3.2, GIRK2) as demonstrated in immunocytochemical staining of monkey bone marrow MSC-DP and immunohistochemical staining of MSC-DP-engrafted striatum using Anti-GIRK2 (Kir3.2) Antibody (#APC-006).