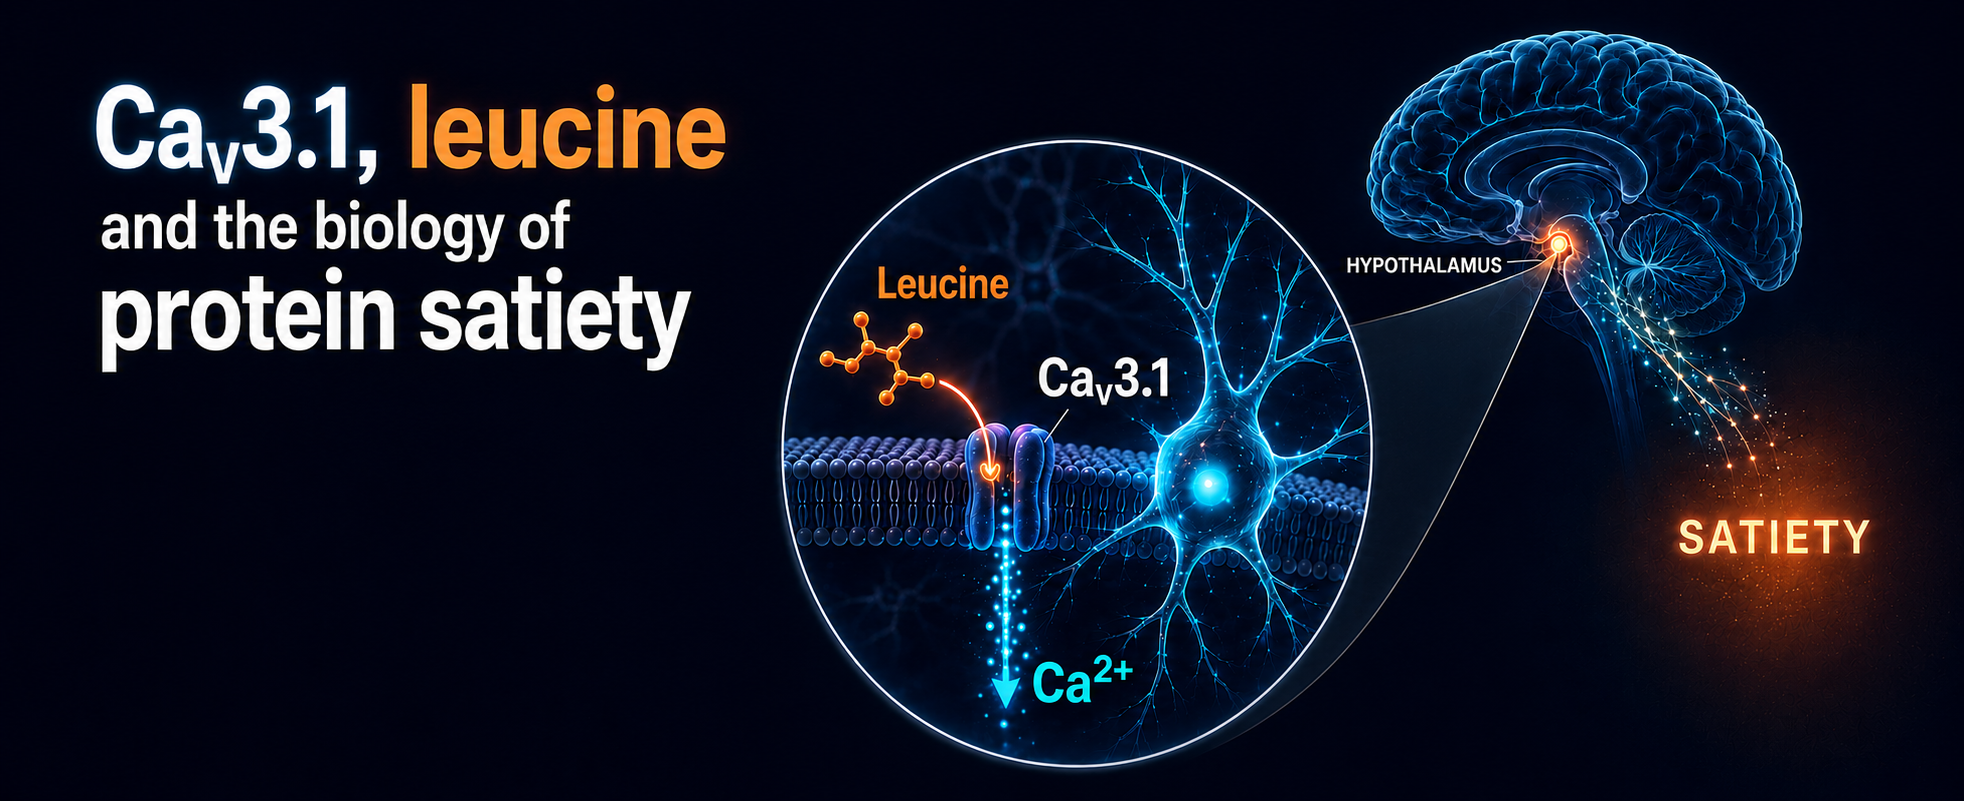
A high-protein meal suppresses appetite, and part of the reason is tucked away in your hypothalamus, where neurons read circulating amino acid levels and adjust degrees of hunger accordingly. Leucine, a branched-chain amino acid (BCAA), has been an interesting part of this story for quite some time due its role in reporting protein availability and curbing food intake when infused into the brain. But the molecular detector in the system has remained hidden.
Work from Tsang and colleagues, published in Cell Metabolism (2026) (1) has identified this molecular detector. The T-type voltage-gated calcium channel (CaV3.1), which is encoded by Cacna1g, binds leucine directly and lowers its own threshold for voltage activation. What we end up with is a channel known as a voltage sensor that also operates as a chemical sensor for a single amino acid.
Finding the Sensor
The team used PhosphoTRAP a molecular profiling method used to identify and sequence mRNA from actively firing neurons, to capture transcripts from mediobasal hypothalamic (MBH) neurons activated by leucine. Cacna1g came out near the top, enriched by ~4.5-fold over non-responsive neurons. Roughly 80% of Cacna1g+/POMC+ neurons fired (C-FOS+), after MBH neurons were exposed to leucine (p < 0.0001). Moreover, using multiplexed RNAscope fluorescence in situ hybridization (FISH) to pinpoint Cacna1g expression, it became clear that about half of leucine-sensing POMC neurons expressed Cacna1g and ~90% of those co-expressed Trpc5.
However, expression is not function, so to test whether CaV3.1 activity is required for leucine-induced activation of POMC neurons, the authors applied Alomone’s selective CaV3.1inhibitor, TTA-P2 (#T-155). This inhibitor abolished leucine-induced activation in mouse primary POMC neurons, in human iPSC-derived POMC neurons, and in brain slice recordings. It also blunted the anorectic response to leucine in MBH neurons from behaving mice. Trpc5 knockouts produced the same loss of leucine-induced depolarization, placing TRPC5 downstream as an amplifier of this process rather than the sensor itself.
CaV3.1 Binds Leucine Directly
Leucine's classic anorectic route runs through mTORC1, a central nutrient, energy, and hormone sensor in the brain that regulates food intake and whole-body metabolism, but this channel sits upstream of it. In HEK293 cells stably expressing human CaV3.1, leucine activated the Ca2+ response with an EC50 of 8.9 µM, inside the physiological cerebrospinal fluid (CSF) leucine range of 7–12 µM. The effect was leucine-specific since valine and isoleucine did not activate the Ca2+ response. In addition, the mTOR blocker, torin 1, didn’t block the CaV3.1-mediated Ca2+ response, ruling out mTOR as sitting upstream of this channel activation.
Voltage-clamp recordings helped to reveal the mechanism. Leucine left-shifted the activation curve from −41.78 to −57.42 mV and the inactivation curve from −47.77 to −60.50 mV (p < 0.05 to p < 0.01). At the resting membrane potential of these cells, that shift moves CaV3.1 from half-activated to fully activated.
The team then used a binding assay, adapted from the method used to characterize the leucine sensor Sestrin2 (2). Fluorescently labeled leucine bound human CaV3.1 by immunoprecipitation with Alomone’s N-terminal Anti-CACNA1G (CaV3.1) Antibody (#ACC-021) (Figure 1). Excess unlabeled leucine competed for the interaction, heat denaturation abolished the interaction, and fluorescently labeled valine failed to bind to CaV3.1. Thus, the interaction is direct, specific, and dependent on intact protein folding.
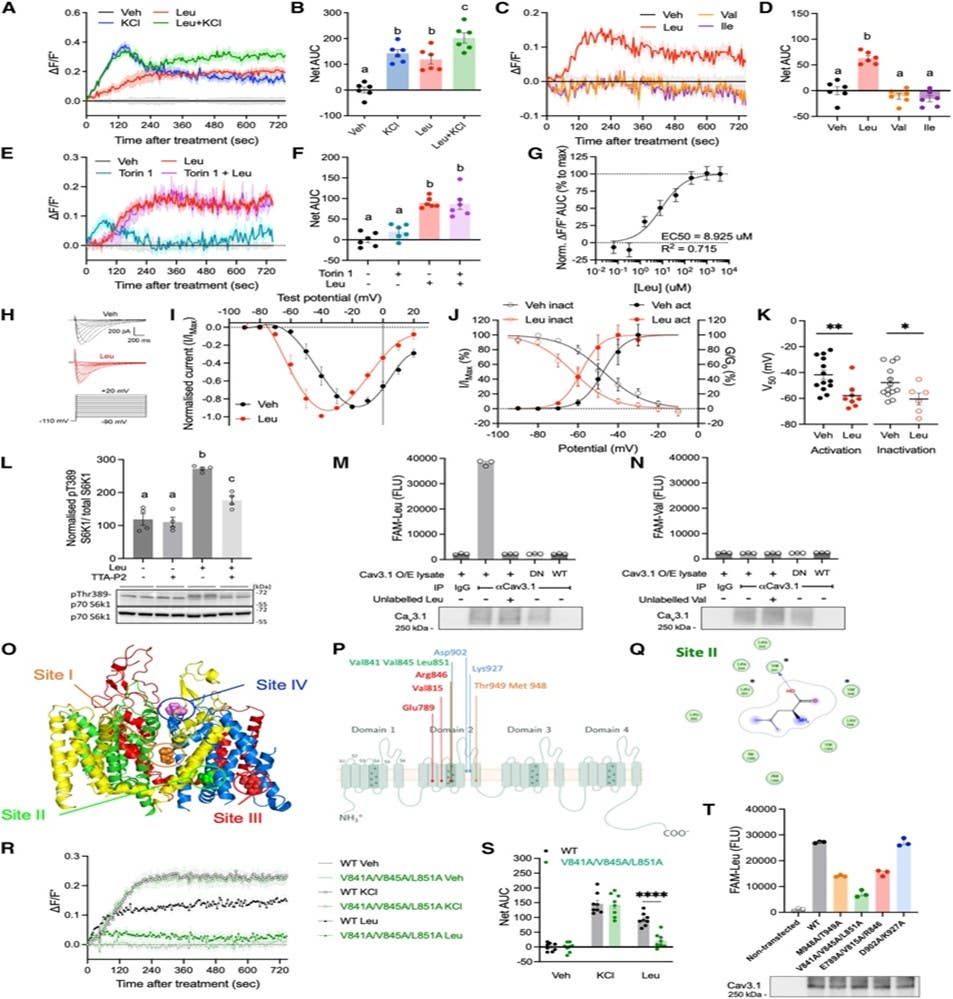
Figure 1. CaV3.1 is a leucine sensor. (A–F) Fluo8 Ca2+ flux assay of HEK293-hCaV3.1 cells. Ca2+ responses and AUC quantification after KCl (50 mM) and Leu administration (1 mM) (A and B); Leu, Val, and Ile treatments (1 mM each) (C and D); or Leu (1 mM) with or without pre-treatment of the mTOR inhibitor torin 1 (100 nM) (E and F); n = 6 per group, merged from 2 independent experiments with triplicates for each. (G) Normalized (Norm.) dose-dependent Leu-induced Ca2+ response (AUC) curve; n = 8 per group, merged from 4 independent experiments with duplicates for each. (H–K) Whole-cell patch-clamp recordings of HEK293-hCaV3.1 cells treated with leucine. (H) Representative traces of Ca2+ currents recorded in vehicle solution (left) and after application of 1 mM leucine. In both cases, cells were held at −100 mV and incremental steps of 10 mV were applied from −90 to +20 mV. (I) Normalized current-voltage (I-V) curves of HEK293-hCaV3.1 cells treated with vehicle or leucine under the activation protocol. (J and K) Steady-state activation (G/Gmax) and inactivation (I/Imax) curves (J) and V50 histogram (K) of HEK293-hCaV3.1 cells treated with vehicle or leucine. Veh_act, n = 13; Leu_act, n = 8; Veh_inact, n= 13; Leu_inact, n = 6. (L) Representative Western blot and densitometry quantification of Thr389 phosphorylation of S6K in HEK293-hCaV3.1 cells treated with leucine (1 mM) with or without co-treatment with TTA-P2 (10 μM). n = 4 per group. Data were merged from 2 independent experiments with duplicates for each. The migration of MW markers is shown on the right side of the lower panel. (M and N) In vitro binding assays of hCaV3.1 to fluorescently labelled leucine (M) and valine (N). Post-assay Western blots below the plots validate successful immunoprecipitation (IP). Immunoglobulin G (IgG), unimmunized rabbit IgG control; DN, heat-denatured cell lysate prior to IP; WT, cell lysate from non-transfected HEK293 cells. The migration of MW markers is shown on the left side of the lower panels in M and N. Data represent 3 technical replicates based on fluorescence measurements. These experiments were repeated twice, with similar results. Data from representative experiments are shown. (O) hCaV3.1 protein (PDB: 6KZO) is shown in a cartoon representation with domain I, II, III, and IV colored red, light blue, yellow, and green, respectively. The representative binding poses of L-leucine are shown in sphere representation with poses relevant to different sites colored distinctly: yellow (putative site I, marked with an orange circle), green (putative site II, marked with a green circle), red (putative site III, marked with a red circle) and light pink (putative site IV, marked with a blue circle). (P) Schematic representation of hCaV3.1 critical amino acid residues of the corresponding predicted leucine-binding sites chosen for mutagenesis experiments, color-coded as in (O). (Q) 2D ligand interaction diagrams for the docked poses of leucine at site II. The residues mutated for experimental validation are shown with asterisks. The dotted arrow signs indicate hydrogen bonding, while the dotted contour around the ligand pose indicates hydrophobic interactions with the residues shown. These diagrams were generated in MOE. (R and S) Fluo8 Ca2+ flux assay of the HEK293-hCaV3.1 site II mutant (V841A/V845A/L851A) cells. Ca2+ responses (R) and AUC quantification (S) after KCl and Leu treatments. n = 8 merged from 4 independent experiments with duplicates for each. (T) In vitro fluorescent leucine-binding assays of WT and site I–IV hCaV3.1 mutants. Post-assay Western blot below the plot validates successful IP. The migration of MW markers is shown on the left side of the lower panel. Data represent 3 technical replicates based on fluorescence measurements. These experiments were repeated twice, with similar results. Data from a representative experiment are shown. Values and Ca2+ response traces are reported as the mean ± SEM. ∗p < 0.05, ∗∗p < 0.01, ∗∗∗∗p < 0.0001. Groups denoted with different letters in (B), (D), (F), and (L) indicate significant differences (p < 0.05). Statistics: one-way ANOVA with Holm-Sidak post-test (B, D, F, and L); least-squares regression with variable slopes (G); paired t-test (K); and unpaired t-test (S).
Figure and legend adapted from Tsang et al. (2026).DOI: 10.1016/j.cmet.2026.03.017.
Docking and mutagenesis studies localized the leucine-binding site on Cav3.1. A hydrophobic pocket between the S4 voltage-sensing segments of domains II and III (residues Val841/Val845/Leu851) is the functional binding site; mutating it left KCl responses intact but cut leucine-induced Ca2+ influx and reduced FAM-leucine binding by ~75%. That binding site sequence is conserved across mammals but is not present in CaV3.2, CaV3.3, or zebrafish protein, pointing to a sensing mechanism specific to mammalian CaV3.1.
Together, this revealed a mechanism where leucine first binds the domain II/III S4 pocket, causing left-shifts in CaV3.1 voltage activation followed by a Ca2+ influx. This is then amplified by TRPC5, leading to POMC depolarization that results in appetite suppression.
CaV3.1 is Required for High-protein Satiety
However, as we all know, great correlation (and pharmacology) is not causation. Therefore, the team deleted Cacna1g. CRISPR knockout of Cacna1g in the MBH neurons (64% reduction) abolished leucine-induced anorexia. On a 45% protein diet, control mice ate less and gained less weight (an effect driven by smaller meals), while knockout mice lost weight. POMC-specific deletion (~60% reduction) reproduced the phenotype, confirming the effect runs through POMC neurons rather than the broader MBH neurons.
The pharmacology runs in the other direction too. The CaV3.1 activator SAK3 reduced food intake and body weight, an effect lost in CaV3. knockout mice. In addition, SAK3 potentiated the GLP-1 receptor agonist liraglutide. Delivered intranasally to diet-induced obese mice, daily SAK3 over two weeks reduced intake, produced weight loss, and amplified the effects of liraglutide.
What This Does and Does Not Say About Protein
This is causal evidence that central leucine sensing is part of why high-protein diets suppress appetite – you knock out the sensor, and you lose the satiety. The detector here is one channel binding one amino acid.
Several caveats are worth noting regarding these results. Every feeding experiment was performed in male mice; sex-dependent effects and human relevance remain untested. CaV3.1 is broadly expressed across the brain, so leucine sensing is unlikely to be confined to feeding circuits. In addition, this mechanism is leucine-specific, which is worth keeping in mind when people talk about BCAAs in general – valine and isoleucine do not engage this channel, so these amino acids have no effect on the pathway described here. At best, a BCAA blend may still engage the pathway to some extent, but only because it contains leucine.
The most relevant caveat is in the obesity data. After eight weeks of high-fat feeding, Cacna1g expression in MBH neurons fell, and the knockout mice showed no phenotype under those conditions. The sensor that makes protein satiating is turned down in the obese state, which is exactly where its appetite-suppressing output would be most useful, i.e. the pathway may work best when the system is responsive and may become blunted in diet-induced obesity. That gap is what a CaV3.1 activator is proposed to fill, and is the reason its developers frame intranasal activation as a way to engage the protein satiety pathway without chronically elevating circulating BCAAs.