Dual BTX Labeling and Advanced Image Analysis
Accurate and reproducible neuromuscular junction (NMJ) imaging is notoriously difficult. The synapse is a complex structure, with presynaptic nerve terminals, postsynaptic receptor clusters, and fine-scale junctional folds that ideally need both high-resolution imaging and reliable quantification. So, to make NMJ characterization that much better and reproducible, a team of scientists have developed a refined NMJ analysis that combes confocal and super-resolution STED microscopy.(1) They make elegant use of two conjugated forms of α-bungarotoxin (BTX) to map acetylcholine receptors (AChRs) at different scales in mice.
Their protocol also gives a detailed computational approach to quantify NMJ morphology, which overcomes common issues like variable receptor distribution, inconsistent labeling, and image processing errors.
Understanding the NMJ is so important because when things go wrong here, the consequences can be devastating, from spinal muscular atrophy (SMA) to congenital myasthenic syndromes (CMS). New protocols like this give the chance to tease out more information about how these disorders disrupt NMJ structure – key to developing treatments.
Fluorescent BTX for Multiparametric NMJ Analysis
To get a better look at NMJ structure on multiple levels, the researchers used two BTX conjugates. BTX is a snake-derived toxin that binds irreversibly to AChRs at the NMJ, making it perfect for visualizing the synapse’s postsynaptic side. But how you tag it matters. The researchers used
- Alexa Fluor 488 BTX (F488-BTX) in confocal microscopy, for 3D reconstruction of NMJ morphology.
- α-Bungarotoxin-ATTO Fluor-633 (#B-100-FR) in STED microscopy, for subsynaptic resolution of receptor clustering and junctional folds.
Along with some key antibodies, these labeling and imaging strategies allowed direct correlation between large-scale NMJ shape and nanoscale receptor organization – something traditional single-method approaches can miss.
The researchers developed a systematic image processing workflow using custom ImageJ macros to ensure consistent quantification across experiments.
Confocal Imaging: NMJ Morphology and Synaptic Area
Using Z-stack acquisitions, the confocal dataset captured
- Total postsynaptic endplate volume
- Maximum intensity projection (MIP) area
- Tortuosity (branching complexity of receptor clusters)
In wild-type NMJs, receptor organization followed a structured, pretzel-like pattern (Figure 1). In contrast, confocal analysis in the disease model showed fragmented and reduced receptor occupancy, reflecting NMJ degeneration.
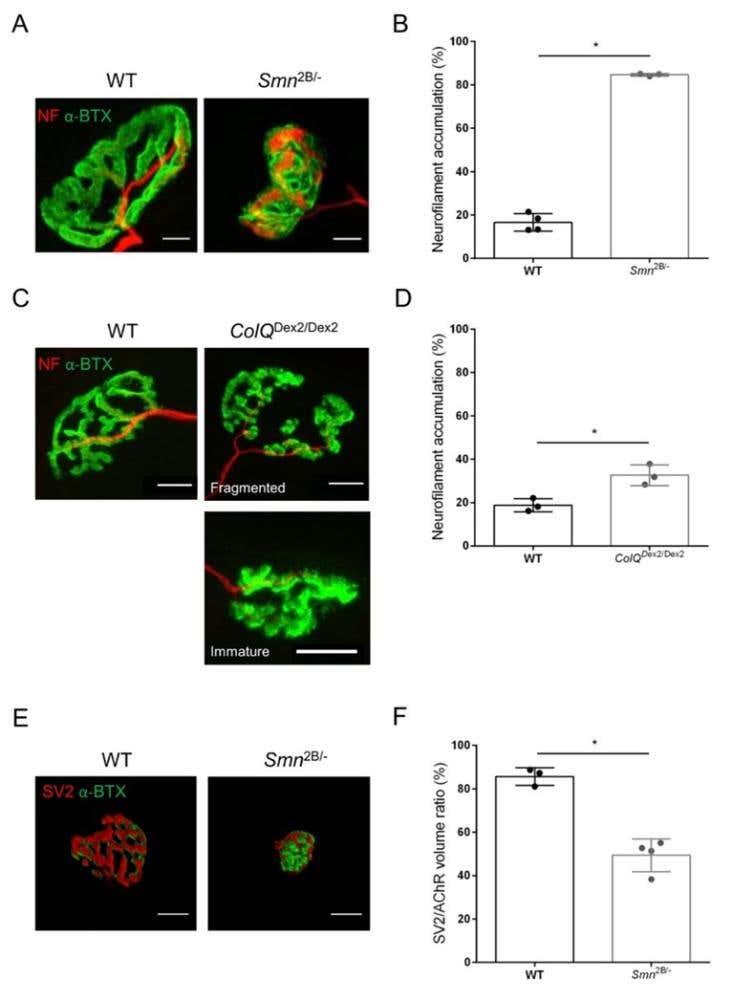
Figure 1. Morphometric analysis of presynaptic axon terminal distribution in muscles of WT and mutant mice. NMJ innervation pattern in tibialis anterior (TA) and gastrocnemius (GA) muscles of wild-type, SMA and ColQ-related CMS mice. (A, B) Representative neuromuscular junctions from TA of WT and Smn2B/- mice at 21 days of age labeled with antibodies against neurofilament M (NF-M, red) and α-bungarotoxin-F488 (α-BTX, green) (A), and results from quantitative analysis of neurofilament accumulation (B); (C, D) Representative neuromuscular junctions from GA of 6 week-old WT and ColQDex2/Dex2 mice labeled with antibodies against neurofilament M (NF-M, red) and α-bungarotoxin-F488 (α-BTX, green), showing fragmented and immature postsynaptic endplates (C), and results of neurofilament accumulation in the two groups of animals (D). N= 4 (n = 34 NMJs) (B) and N = 3 (n = 54 NMJs) (D) WT animals, and N=3 (n = 36 NMJs) Smn2B/- and N = 3 (n = 55 NMJs) ColQDex2/Dex2 mice were analyzed in the experiments (B, D). (E, F) Representative images of axon terminal occupancy in NMJs from TA of 3 week-old WT and Smn2B/- mice labeled with antibodies against synaptic vesicle glycoprotein 2 (SV2, red) and α-bungarotoxin-F488 (α-BTX, green) (E), and results of NMJ occupancy (SV2/AChR volume ratio) (F). Muscles from N = 3 (n = 50 NMJs) wild-type and N = 4 (n = 62 NMJs) Smn2B/- mice were analyzed. Data are expressed as the mean value per mouse (dot) ± SEM. Differences between groups were analyzed by Mann-Whitney test (* p < 0.05). Scale bars are 20 µm.
Nanoscale Receptor Organization
Super-resolution imaging with α-Bungarotoxin-ATTO Fluor-633 allowed the team to quantify AChR stripe width and junctional fold spacing, to reveal subtle structural changes not detectable by confocal microscopy.
- Healthy NMJs showed uniform receptor stripes with tight spacing.
- Disease models had wider AChR stripes and increased receptor spacing, indicative of synaptic immaturity or structural disorganization.
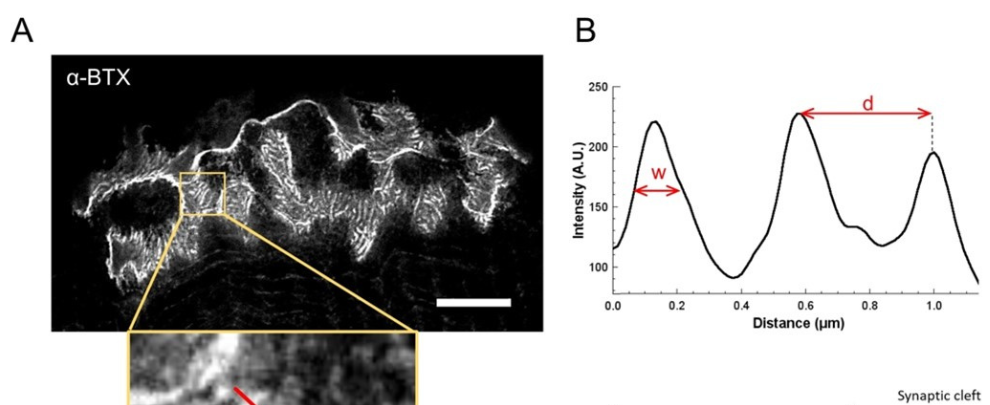
As you can see, STED’s ability to resolve receptor-level defects make it an invaluable addition to NMJ structural analysis (Figure 2).
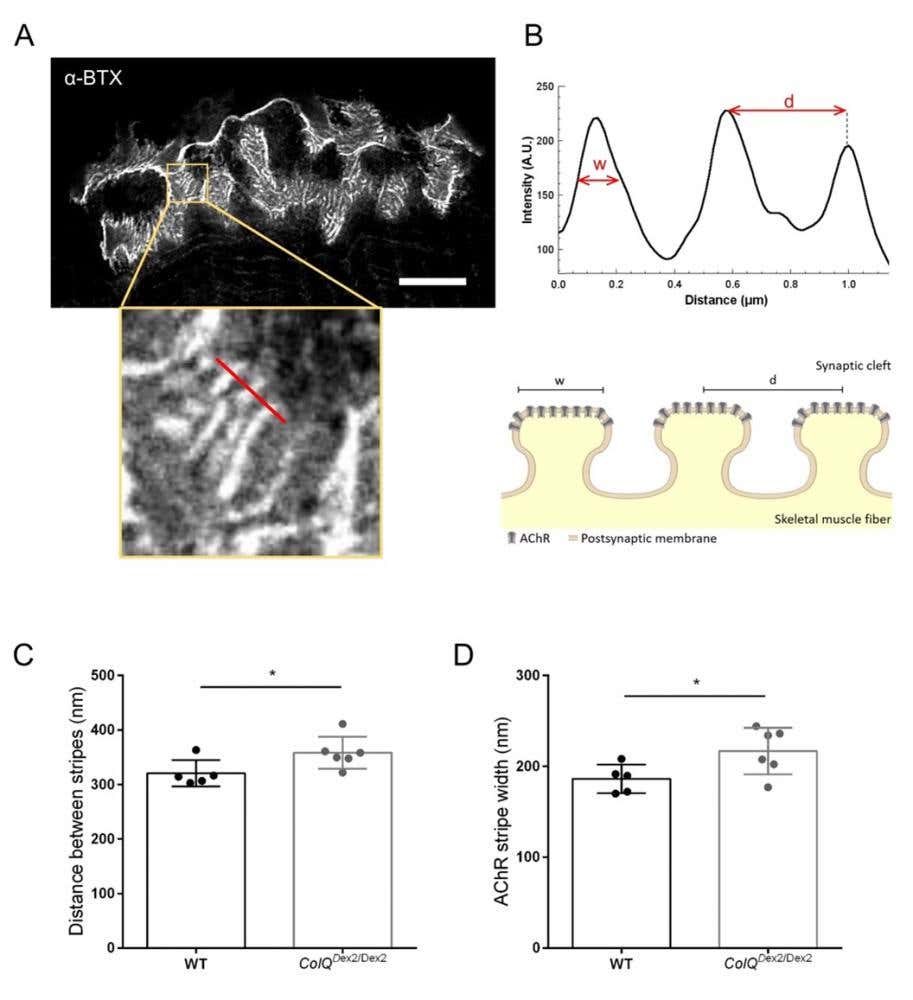
Figure 2. STED imaging of NMJ postsynaptic endplates. (A) Representative STED image of a NMJ labeled with α-bungarotoxin-F633 (α-BTX) from gastrocnemius of a 6 week-old wild-type mouse showing postjunctional AChR stripes (scale bar is 5 µm). (B) Higher magnification of a region with AChR stripes (bottom panel) that was used to generate the intensity profile. The width (w) of AChR stripes and the distance between two adjacent stripes (d) of this region were quantified and presented in the bar graph. Schematic representation of the postsynaptic endplate to illustrate AChR stripe width (w) and distance (d). These parameters, (C) AChR stripe distance and (D) width, were measured in ColQDex2/Dex2 mice and control littermates at 6 weeks of age. NMJs from 5 WT (total n = 29 NMJs) and 6 ColQDex2/Dex2 (total n = 43 NMJs) animals were analyzed blindly. Data are expressed as the mean per mouse (dot) ± SEM. Statistical differences between groups were analyzed by using the Mann-Whitney test (* p < 0.05).
Why This Approach Stands Out
By pairing BTX for receptor mapping with antibodies for nerve terminal or cytoskeletal components, this study was able to correlate receptor organization with broader NMJ morphology, something that neither labeling method could achieve alone. And with automated image processing and standardized data extraction across samples they introduced as little user bias as is possible – great news for reproducibility.
Fluorescently conjugated toxins like BTX offer distinct advantages over traditional labeling methods, particularly in an area like NMJ imaging. Unlike antibodies, which typically require permeabilization and secondary amplification, BTX binds directly and irreversibly to extracellular AChRs to give accurate, high-contrast labeling of the postsynaptic membrane without background signal from unbound secondary antibodies. This is ideal for super-resolution techniques like STED, where non-specific binding or excessive label size can blur fine structural details.
That said, you can get even more out of BTX labeling by using it alongside antibody markers, which allow simultaneous visualization of presynaptic structures like axon terminals and synaptic vesicles. It’s all about using the right tool for the right job, and in the case, using conjugated toxins alongside antibodies across different imaging techniques gives wonderfully accurate and reproducible results.