Cell extrusion is essential for maintaining tissue integrity and function. In epithelial layers, where cells are tightly packed and constantly renewing, extrusion provides a controlled way to remove excess, damaged, or less fit cells without disrupting the barrier. This prevents overcrowding, preserves optimal cell density, and ensures that only the most functionally capable cells remain. When extrusion is dysregulated, it can contribute to disease—either through excessive cell loss, weakening tissues, or insufficient removal, leading to abnormal cell accumulation as seen in cancer.
Epithelial monolayers maintain stable cell numbers despite constant turnover – dividing cells add, extruding cells remove, and the balance is tight. When crowding exceeds a homeostatic threshold, live cells are expelled apically through coordinated actomyosin contraction driven by the Piezo1-sphingosine-1-phosphate (S1P)-S1P2-Rho pathway.
The mechanism of cell extrusion has been characterized for over a decade. What remained unresolved was the rule regarding selection: within a crowded field where many cells experience the same mechanical pressure, why does one cell extrude while its equally compressed neighbors stay put?
Several ideas were tested and eliminated. Dry mass, measured by quantitative phase imaging (QPI) in Madin–Darby canine kidney II (MDCKII) epithelial monolayers, does not change before extrusion – thus, lower cell mass isn’t the answer. Calcium signalling, tracked with the GFP Ca2+ indicator, GECO1, shows no spike before live cell extrusion (LCE); there’s actually a dip. The most mechanically compressed cell is not obviously the one that goes. A study in Nature (1) offers a different answer, where the cell with the least energy leaves first.
Before Extrusion, a Brief Shrink
Approximately 70% of cells destined for live extrusion undergo a transient volume loss at roughly 6.5 minutes before the extrusion machinery engages. This phenomenon is referred to as homeostatic early shrinkage (HES). Yet fewer than 0.03% of filmed cells (8 out of 750) shrank without going on to extrude, and those exceptions occurred in uncrowded regions where LCE does not normally operate. Shrinkage, in a crowded context, predicts extrusion with high reliability.
And that volume threshold matters. Under experimental osmotic challenge, only cells that shrank by approximately 20% (±3%) in volume subsequently extruded; those shrinking around 11% (±2.5%) did not. The relationship is not continuous – there is a threshold. Semi-automated tracking via a phase-contrast brightening assay (the authors’ “lightning assay”), confocal GFP volumetrics, and Calcein-AM quenching all confirmed the same result through orthogonal methods.
Importantly, HES sits upstream of the extrusion pathway. GsMTx4, a Piezo1 inhibitor, did not prevent shrinkage. Blocking actomyosin contractility with Y-27632 or blebbistatin actually increased shrinkage frequency, suggesting contractility normally suppresses shrinkage by stabilizing junctions. These results all suggested that cell shrinkage is the event that initiates extrusion, rather than being simply downstream noise from an extruding cell.
The Ion Channel Cascade
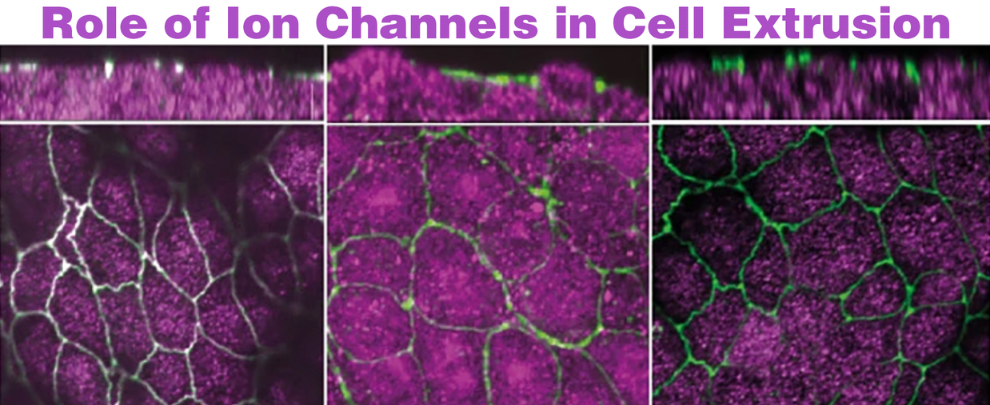
A targeted HES inhibitor screen identified two families of K+ and Cl– channels required for the specific shrinkage step. The voltage-gated K+ channel inhibitor 4-aminopyridine (4-AP), which targets KV1.1 and KV1.2 channels inhibited HES as did DCPIB, which targets the volume-regulated anion channel SWELL1 (LRRC8A). Knockdown of KV1.1, KV1.2, or SWELL1 individually abolished both osmotic-induced and homeostatic extrusion. Immunostaining with Alomone’s Anti-KV1.1 (KCNA1) (extracellular) Antibody (#APC-161), Anti-KV1.2 (KCNA2) Antibody (#APC-010), and Anti-LRRC8A (extracellular) Antibody (#AAC-001) (SWELL1) showed apical localization in all cases. Interestingly, KV1.1 co-localized with ZO-1 at tight and tricellular junctions, which are regions where epithelial tension sensing occurs (Figure 1).
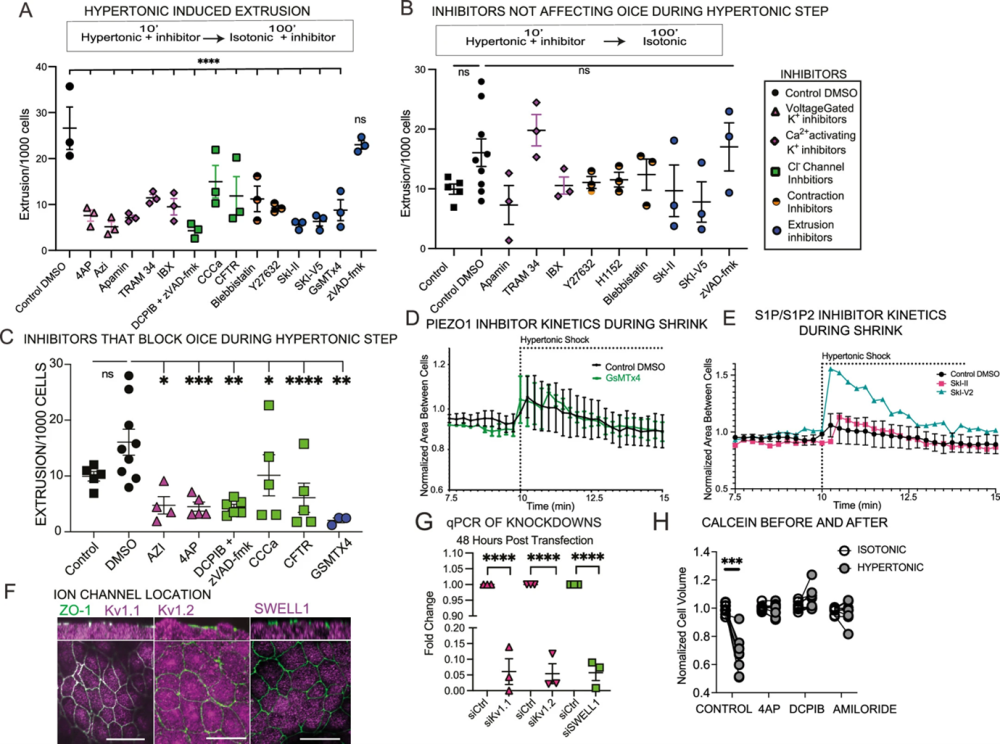
Figure 1. The effects of ion channel inhibitors on extrusion and shrinkage. A, Mean extrusion rate ±SEM in monolayers pre-treated with inhibitors during both hypertonic treatment and return to isotonic media. B, Mean extrusion rate ±SEM pre-treated with inhibitors but only continued during hypertonic treatment, boxes outlined above graphs; n = 3 experiments where ns is from two-way ANOVA with Dunnett’s multiple comparisons test. The inhibitor key for both A and B describes the ion channel family inhibitor target by assigned color and icon. C, Mean extrusion rate ±SEM from monolayers treated with inhibitors only during the 10’ 20% hypertonic treatment; n = 3; *P = 0.0142 (AZI), ***P = 0.0003 (4AP), **P = 0.003 (DCPIB), *P = 0.0134 (CCCa), ****P < 0.0001(CFTR), and **P = 0.0011 (GSMTX4) from two-way ANOVA with Dunnett’s multiple comparisons test. Representative “lightning assay” where increased space around the cells indicates cell shrinkage in the presence of: D, Sretch-activated ion channel (SAC) inhibitor GSMTX4, or E, S1P/S1P2 inhibitors. The inhibitors were compared to DMSO controls before and during hypertonic media incubation (mins). F, Representative confocal projections and XZ confocal images of Kv1.1/1.2, or SWELL1 (magenta) with apical tricellular junction protein ZO-1 (green). XY Scale bar=20 μm; n = 3. G, Scatter plots show fold changes (2−∆∆Ct) at 48 h post transfection with respective siRNas; the first shows n = 3; ****P = 0.0001 from an unpaired t-test. H, Normalized mean cell volume ±SEM before and after experimentally inducing shrinkage; n = 6; ***P = 0.0004 from a ratio paired two-tailed t-test. All n’s are independent two-tailed experiments.
Image taken from Mitchel et al. (2025). https://doi.org/10.1038/s41586-025-09514-w.
Since KV1.1 and KV1.2 are voltage-gated, their activation implies a preceding depolarization event. Cells loaded with DiBAC4(3), a fluorescent dye which becomes brighter when depolarized, showed depolarization on average around five minutes before shrinking, while non-shrinking neighbors showed no depolarization. Moreover, Na+ entry through the epithelial Na+ channel (ENaC) induced the depolarization and fluorescent Na+ dye CoroNa-AM imaging, detected elevated intracellular Na+ before both HES and extrusion. Amiloride (ENaC inhibitor) blocked depolarization, while 4-AP did not, placing ENaC upstream of KV1.1/KV1.2 in the pathway. Knockdown of any ENaC subunit (α, β, or γ) prevented both shrinkage and extrusion. Acute mechanical crowding showed increased Na⁺ entry in an ENaC-dependent manner, which confirmed that ENaC functions as the crowding sensor at the top of the cascade.
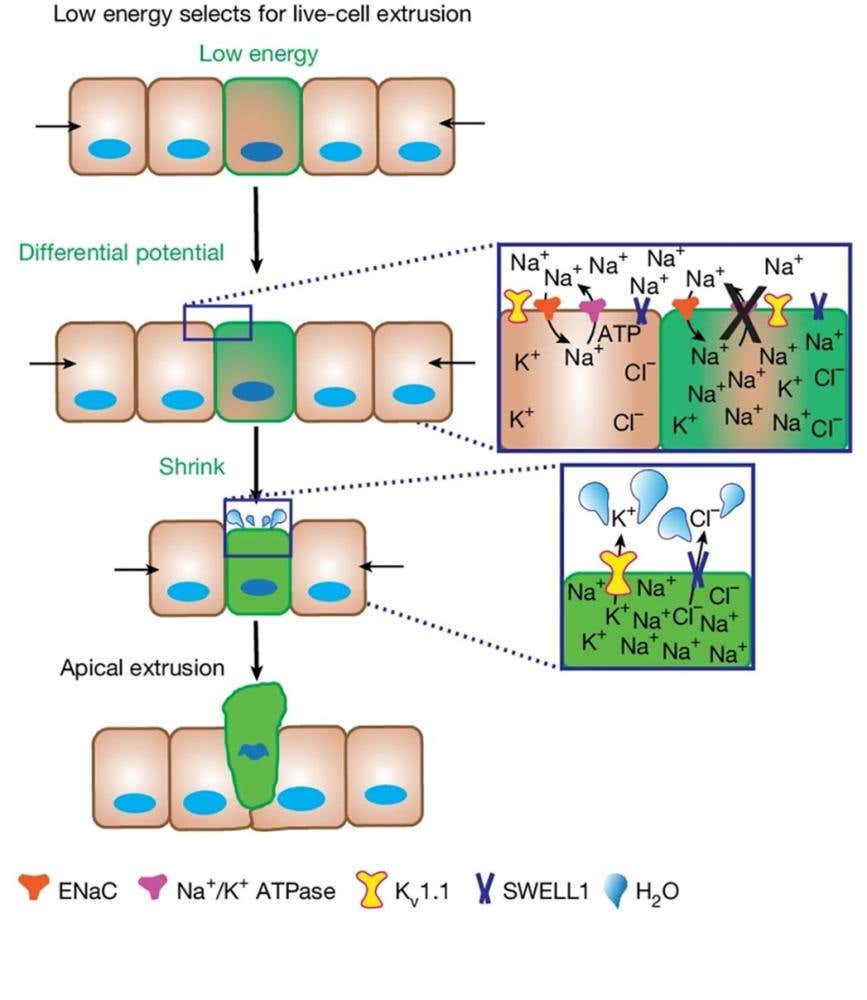
The full chain of events comprises the following steps: crowding → ENaC-mediated Na+ influx → membrane depolarization → KV1.1/KV1.2 and SWELL1 activation → K+ and Cl– efflux → osmotic water loss → cell shrinkage past the ~17–20% threshold → Piezo1 → extrusion.
ATP as the Deciding Variable
All crowded cells experience ENaC-driven Na+ influx, yet only a subset extrudes. The Na+/K+ ATPase accounts for an estimated 25–70% of total cellular ATP consumption and is required for repolarization after Na+ influx. Cells with adequate ATP restore their Na+ balance and survive the crowding challenge; cells with insufficient ATP cannot.
Simultaneous imaging of ATP-Red, the genetically encoded sensor QUEEN37, and DiBAC4(3) showed that ATP declines before depolarization, which precedes shrinkage – in that order. ATP reduction is not a consequence of the process; it precedes it. Pharmacological depletion of ATP with oligomycin A increased shrinkage rates and more than doubled extrusion rates in ex vivo mouse bronchial epithelium (P = 0.0093, unpaired t-test). In addition, glucose supplementation reduced the extrusion rates (P < 0.0001). Moreover, Piezo1 inhibition blocked neither ATP depletion nor depolarization, confirming that Piezo1 is downstream of extrusion process.
The selection logic is relative, not absolute. Extruded cells are not dying at the moment of ejection, but rather they retain enough energy to complete the process, and they can re-establish and proliferate if given a new substrate. The mechanism eliminates cells at the lower end of the ATP distribution within a crowded neighborhood, not cells that have catastrophically failed.
What the Pathway Reveals
ENaC, KV1.1, KV1.2, and SWELL1 constitute the earliest selection layer controlling which cell exits. ENaC and CFTR dysfunction drive cystic fibrosis pathology; ENaC, KV1.1, and KV1.2 dysregulation correlates with poor prognosis across multiple cancer types. Whether aberrant channel function disrupts extrusion balance in those contexts – producing inappropriate cell accumulation or excess loss – remains to be tested. But the mechanism is now resolved at the molecular level, and ATP sufficiency, read through membrane potential, determines epithelial fate under crowding conditions (Figure 2).

 (extracellular) Antibody")
 Antibody")
 Antibody")
 (extracellular) Antibody")

