T cells are central players of the adaptive immune response, which help protect the host against different pathogens ranging from bacteria to fungi and viruses. In order to perform their function, T cells need to be activated, a process that could lead to a variety of responses including proliferation, migration, cytokine production and even apoptosis. The “decision” by T cells to become activated or not is crucial: an inappropriate or exaggerated response could lead to autoimmune diseases while a failure to respond could lead to infection and death. To perform such a complex and sensitive task, T cells must respond to environmental cues that stimulate a complex signaling cascade. In the last few years, the signaling mechanisms that govern T cell activation and their subsequent cellular responses have been closely studied. In the present review we will examine the main signaling cascades involved and discuss several molecules that are being used to specifically block some of these pathways.
Introduction
T cell activation that leads to a productive response (i.e. cytotoxicity of target cells or stimulation of antibody production by B cells) needs two signals. The primary signal (or signal one) is provided by the binding of foreign antigens (usually small peptides from the respective pathogen) to the T cell antigen receptor (TCR) in the context of the class II major histocompatibility complex (MHC). The TCR is a complex of six different polypeptides. The clonotypic α and β chains provide the specificity of the ligand binding by a process of genetic rearrangement that provides millions of receptor variants. While the α and β heterodimer binds directly to the peptide/MHC complex, the engagement of the intracellular signaling machinery is through the invariant components of the TCR: the γ, δ and ε chains (collectively known as the CD3 complex) and the ζ chains1,2.
Signal two or the costimulatory signal is provided by interaction of coreceptors such as CD28 or CD4 with their counterparts in the antigen presenting cell (APC)1,2.
The main signaling pathways elicited by binding of the TCR and some of the coreceptors are depicted in Figure 1.
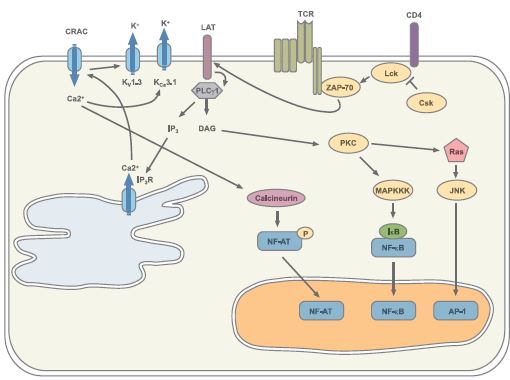
Please note that not all the molecules involved in the signaling cascades are illustrated here for simplification purposes.
The Tyrosine Kinases (and their kinases) Signaling Pathway
The principal signaling pathway following TCR engagement is protein tyrosine phosphorylation. The tyrosine phosphorylation cascade will ultimately activate several transcription factors such as NF-AT and AP-1 which in turn direct the transcription of the new genes needed for T cell response.
The earliest detectable event following ligation of the TCR by the peptide-MHC complex is the activation of the Src family protein tyrosine kinases Lck and Fyn3. They phosphorylate specific motifs (called immunoreceptor tyrosinebased activation motifs or ITAMs) present on the ζ and CD3 subunits of the TCR complex. Phosphorylation of these motifs promotes recruitment and activation of ZAP-70, another tyrosine kinase which in turn activates several target proteins including the adaptor/linker proteins LAT and SLP-764,5,6. Phosphorylation of LAT and SLP-76 recruits into their vicinity and facilitates the activation by tyrosine phosphorylation of the phospholipase Cγ1 (PLCγ1). PLCγ1 catalyzes the formation of the second messengers, inositol 1,4,5-trisphosphate (IP3) and diacylglycerol (DAG), which, respectively, trigger Ca2+ flux and contribute to protein kinase C (PKC) and Ras activation (see also below)7.
Since protein tyrosine phosphorylation is such a crucial force in T cell signaling it must be carefully controlled. This is achieved mainly by the action of the tyrosine kinase Csk which phosphorylates a critical Tyr at the C-terminal domain of Lck rendering it inactive3.
The preponderancy of the tyrosine kinase cascade in T cell signaling is demonstrated by the use of tyrosine kinase inhibitors such as Genistein (#G-300) which are able to block T cell function both in vitro and in vivo8,9. Other non-specific kinase inhibitors such as Staurosporine (#S-350) can also be used to block T cell function.
PKC and Ras activation results in the activation of several members of the mitogen-activated protein kinase (MAPK) superfamily. The MAPKs are serine/threonine kinases that activate kinases (and other) signaling cascades that result in the activation of the transcription factors NF-κB and AP-1, both of which are necessary for the transcription of several key genes involved in the T cell immune response. Three MAPK subfamilies have been described: the extracellular signal regulated kinase (ERK), the Jun-NH2-terminal kinase (JNK) and the p38, all of which play an important role in T cell activation.
Use of specific inhibitors for the different MAPK such as the p38 inhibitor SB203580 (#S-370) or the ERK inhibitor U0126 (#U-400) have helped unravel the complex signaling cascades activated by TCR-dependent T cell activation27,28.

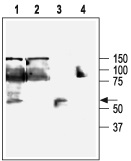
Genistein (#G-300) inhibits the Tyrosine phosphorylation of 28 kDa protein. Hela cells were grown to 70% confluency, and the cells serum starved for 18 h. The cells were preincubated for 30 min in presence or absence of 500 nM Genistein and simulated for 2 h with or without 20% fetal calf serum. The cell extracts were analyzed by Western blotting by probing with phospho-Tyr specific antibodies.
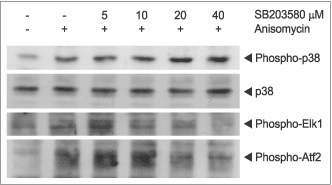
SB203580 (#S-370) inhibits the phosphorylation of Elk1 and Atf2 caused by p38 MAPK. 3T3-L1 cells were grown to 70% confluence and then serum starved for 3 h. The cells were incubated for 2 h with various concentrations of SB203580 and stimulated with 5μM Anisomycin (#A-520). The cell proteins were resolved by SDS PAGE, probed with antiphospho-p38 MAPK, anti-p38 MAPK, anti-phospho-Elk1 and anti-phospho-Atf2. The phophorylation of Elk1 and Atf2 was reduced as a function of SB203580 concentration.
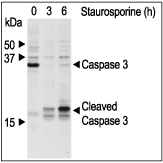
Staurosporine (#S-350) induces apoptosis and inhibits phosphorylation. Jurkat cells were grown to 70% confluency, then 2 μM Staurosporine or vehicle was added for 3 or 6 hours. At the end of the incubation period, the cells extracts were probed for Caspase 3 and cleaved Caspase 3 with specific antibodies.
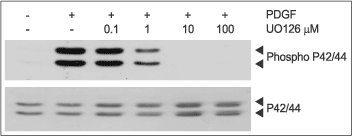
U0126 (#U-400) inhibits P42/44 MAPK phosphorylation. C6 glioma cells were grown to 70% confl uence and then serum starved for 1.5 h. The cells were then incubated for 2 h with various concentrations of U0126 as indicated in the picture and stimulated with or without 7ng/ml PDGFAA. The cell proteins were resolved by SDS PAGE, probed with anti phospho-P42/44 MAPK (upper panel) or with anti P42/44 MAPK (lower panel). The inhibition of P42/44 MAPK phosphorylation by U0126 increased respectively with the increase in U0126 concentration.

Cyclosporin A (#C-900) inhibits the antiadipogenic effect of Ca2+ dependent protein phosphatase (calcineurin). 3T3-L1 preadipocytes were induced to undergo adipocyte differentiation with 1μg/ml insulin for 4 days (A, B and C ). Cells were additionally treated for the first 4 days of differentiation with 1 μM Ionomycin (#I-700) (B-D) in the presence of 10 ng/ml (C) or 50ng/ml (D) Cyclosporin A. After 10 days the cells were stained with Oil Red O and visualized with light microscopy.
Ca2+-dependent Signaling and the Elusive CRAC Channel
A sustained elevation of intracellular Ca2+ is an indispensable step for a productive T cell activation. Elevated intracellular Ca2+ levels need to be maintained for several hours in order to permit downstream signaling events such as NF-AT translocation to the nucleus10. This sustained Ca2+ elevation is accomplished by the concerted action of several receptors, kinases and ion channels.
As mentioned above, PLCγ1 catalyzes the formation of IP3 which binds to the IP3 receptor (IP3R) located in the endoplasmic reticulum (ER) membrane. Activation of the IP3R induces a brief spike in intracellular Ca2+concentration due to the release of Ca2+ from the ER stores. The continuous activation of the IP3R depletes the ER Ca2+ stores, an event that triggers the opening of the Ca2+ release-activated-Ca2+ channel (CRAC) in the plasma membrane by an as yet unknown mechanism. Only the opening of the plasma membrane CRAC channel permits entry of sufficient Ca2+ in order to maintain the required high intracellular levels. Because Ca2+ entry depolarizes the cell and thus reduces the driving force for further Ca2+ entry, a sustained Ca2+ entry can only be achieved by the participation of a voltage-gated K+ channel. In the case of T cells, this channel is the voltage-dependent K+ channel KV1.3. The KV1.3 channel is located in the plasma membrane and opens in response to the membrane depolarization caused by Ca2+ entry. Opening of the channel produces an efflux of K+ thus restoring the negative membrane potential that will permit further Ca2+ entry11. Another channel involved in the regulation of Ca2+ entry is the intermediate conductance Ca2+-activated K+ channel, KCa3.1 (also known as KCNN4, SK4 or IKCa1). This channel is structurally similar to the KV1.3 channel but it opens in response to a rise in intracellular Ca2+ instead of membrane depolarization.
The pivotal role of the K+ channels in controlling T cell activation and proliferation was demonstrated by the use of several channel-blocking compounds such as Charybdotoxin (#STC-325), Margatoxin (#STM-325) and Stichodactyla toxin (ShK) (#STS-400) that were able to block T cell function both in vitro and in vivo22-24. As KV1.3 channel levels were shown to be upregulated in T cells infiltrating the brain of multiple sclerosis patients, treatment of these patients with K+-channel blockers could offer a very attractive therapy in the near future24.
Remarkably, about 75% of the T cell activation regulated genes show a dependence on Ca2+ influx through the CRAC channels. The importance of Ca2+ entry through CRAC channels in T cell activation is highlighted by the fact that patients with a complete absence of CRAC channel activity show a phenotype of severe immunodeficiency13,14.
Although a great deal is known regarding the biophysical, electrophysiolocical and pharmacological characteristics of the CRAC channel, the molecular identity of the channel remains elusive. Several members of the transient receptor potential (TRP) channel superfamily have been proposed to be good candidates to encode the CRAC channel including TRPC115, TRPC316, TRPV617, and TRPM218, as well as members of the voltage-gated Ca2+ (CaV) channel family19-21.
The rise in intracellular Ca2+ permits the activation of the phosphatase calcineurin, among others. Calcineurin dephosphorylates NF-AT in the cytosol inducing its activation and allowing it to translocate to the nucleus12. The importance of the calcineurin-NF-AT pathway is underscored by the fact that the widely used immunosuppressants Cyclosporin A (#C-500) and FK-506 (#F-900) target this particular interaction. Their immunosuppressive activity stems from the fact that inhibition of NF-AT activation and translocation to the nucleus results in the inhibition of the transcription of key genes involved in the immune response25.
Concluding Remarks
A great deal of progress has been made in the last few years towards elucidating the molecular mechanisms involved in the control of T cell activation. The major signaling cascades are now fairly well understood and some of the complex interactions between them have been also deciphered.
What is certain is that activating a T cell is not a simple matter, but given the potentially disastrous results of an inappropriate T cell response, this may be a good thing.

Immunohistochemical staining of KCa3.1 with Anti-KCNN4 (KCa3.1, SK4) Antibody (#APC-064) in rat spleen. (A) and (C) Secondary (activated) follicle in the spleen white pulp showing intense staining of Marginal Zone and Periarteriolar T-lymphocytes (white and yellow arrows, respectively); note that cells in the red pulp and B lymphocytes in the germinal center are not stained. (B) The counterstain is Hoechst 33324.
1, 3. Anti-KCNN4 (KCa3.1, SK4) Antibody (#APC-064) (1:200).2, 4. Anti-KCNN4 (KCa3.1, SK4) Antibody, preincubated with the negative control antigen.

FK-506 (#F-900) inhibits the antiadipogenic activity of calcineurin. 3T3-L1 preadipocytes were induced to undergo adipocyte differentiation with 1μg/ml insulin for 4 days (A, B and C). As indicated cells were additionally treated for the first 4 days of differentiation with 1 μM Ionomycin (#I-700) (B and C) in presence (C) or absence (A and B) of 5 ng/ml FK-506. After 10 days the cells stained with Oil Red O and visualized with light microscopy. A.

Human Jurkat cells (a T cell leukemia line) were either left untreated or treated with 1mg/ml phytohemagglutinin A (PHA) for 24 hours. Surface expression of the KV1.3 channel was studied using an Anti-KV1.3 (KCNA3) (extracellular)-FITC Antibody (#APC-101-F) directly labeled with the fluorophore FITC and analyzed in a flow cytometer. Untreated and unstained cells are shown in violet. Untreated cells stained with the antibody are shown in green while PHA- treated stained cells are shown in blue. Note that PHA-treated cells show a marked surface upregulation of the KV1.3 channel.

Inhibition of heterologously expressed KV1.3 channels by 10 nM of Margatoxin (#STM-325). Left: time course of current amplitude change, upon application of toxin. Currents were recorded with extracellular ND96 solution and were elicited every 10 seconds by 100 ms pulse to 0 mV (holding potential was –100 mV). The bar represents period of toxin perfusion. Right: superimposed traces before (violet) and during (black) application of 10 nM Margatoxin.

Irreversible inhibition of KV1.3 channel current expressed in Xenopus oocytes by 25 nM Stichodactyla Toxin (ShK) (#STS-400). Using TEVC, membrane potential was held at -100 mV and currents were elicited by 100 ms voltage steps to 0 mV delivered every 10 seconds. Left: Traces of currents before (violet) and during bath perfusion of 25 nM ShK. Right: The time course of amplitude change in the same experiment. The period of toxin application is indicated by the horizontal bar.

The effect of 100 nM Charybdotoxin (#STC-325) on KV1.1 (left) and KV1.3 (right, coexpressed with KVβ1.1) channels, expressed in Xenopus oocytes. In both cases the currents were recorded with standard ND96 solution (see above), Membrane holding potential was –100 mV, stepped every 15 s. to +20 mV for 100 ms. The vertical bar represents 0.1 and 3 μA for KCa1.1 and KV1.3 respectively.
References
- Grakoui, A. et al. (1999) Science 285, 221.
- Judd, B.A. and Koretzky, G.A. (2000) Rev. Immunogenet. 2, 164.
- Hermiston, M.L. et al. (2002) J. Clin. Invest. 109, 9.
- Clements, J.L. et al. (1999) Annu. Rev. Immunol. 17, 89.
- Chan, A. et al. (1992) Cell 71, 649.
- Zhang, W. et al. (1998) Cell 92, 83.
- Weiss, A. et al. (1991) Proc. Natl. Acad. Sci. U.S.A. 88, 5484.
- Trevillyan, J.M. et al. (1990) J. Immunol. 145, 3223.
- O’Connor, T.P. et al. (2002) J. Nutr. 132, 2283.
- Lewis, R.S. (2001) Annu. Rev. Immunol. 19, 497.
- Krasznai, Z. (2005) Arch. Immunol. Ther. Exp. 53, 127.
- Crabtree, G.R. and Olson, E.N. (2002) Cell 109, S67.
- Quintana, A. et al. (2005) Pflugers. Arch. 450, 1.
- Feske, S. et al. (2005) J. Exp. Med. 202, 651.
- Mori, Y. et al. (2002) J. Exp. Med. 195, 673.
- Philipp, S. et al. (2003) J. Biol. Chem. 278, 26629.
- Cui, J. et al. (2002) J. Biol. Chem. 277, 47175.
- Sano, Y. et al. (2001) Science 293, 1327.
- Kotturi, M.F. et al. (2003) J. Biol. Chem. 278, 46949.
- Stokes, L. et al. (2004) J. Biol. Chem. 279, 19566.
- Badou, A. et al. (2005) Science 307, 117.
- Freedman, B.D. et al. (1992) J. Immunol. 149, 3784.
- Koo, G.C. et al. (1997) J. Immunol. 158, 5120.
- Beeton, C. et al. (2001) Proc. Natl. Acad. Sci. U.S.A. 98, 13942.
- Crabtree, G.R. et al. (2001) J. Biol. Chem. 276, 2313.
- Dong, C. et al. (2002) Annu. Rev. Immunol. 20, 55.
- Zhang, J. et al. (1999) J. Immunol. 162, 3819.
- DeSilva, D.R. et al. (1998) J. Immunol. 160, 4175.