Following hypoxia or inflammation, extracellular nucleotide release can activate two families of receptors, the ionotropic P2X receptors with seven subtypes (P2X1-7), and the metabotropic G-protein coupled P2Y receptors, which are the focus of this review. Eight mammalian P2Y receptors have been identified on the basis of sequence homology and pharmacological profile: the P2Y1, P2Y2, P2Y4, P2Y6, P2Y11, P2Y12, P2Y13 and P2Y14. Alomone Labs has been and remains quite active in this field of research and this brief report summarizes how Alomone Labs’ P2Y products have influenced the advances made.
P2Y Receptors
Hypoxia or inflammation, activates the release of extracellular nucleotides such as ATP and UTP which interact with cell surface P2Y receptors to produce a broad range of physiological responses including cardiac function, platelet aggregation and smooth muscle cell proliferation1,2.
Two subfamilies are defined within the P2Y family, which are distinct from each other on the basis of sequence identity and signaling properties: The P2Y1 subfamily includes the P2Y1, P2Y2, P2Y4, P2Y6 and P2Y11 receptors and is coupled to phospholipase C, mediating increases in inositol triphosphate (IP3). The P2Y12 subfamily consists of the P2Y12, P2Y13, and P2Y14 receptors and is coupled to the inhibition of adenylyl cyclase.
P2Y receptors are widely distributed in the nervous system, as well as in many other peripheral tissues. All P2Y receptor subtypes are capable of modulating ion channels (with the exception of P2Y14 that has not been characterized yet)1.
Subtype specific antibodies provide a very powerful tool for exploring tissue distribution, expression and localization of the receptors by different methods such as Western Blotting, Immunohistochemistry, Immunocytochemistry and Flow Cytometry. Alomone Labs’ P2Y antibodies provide a powerful tool in exploring the various roles of these receptors.
The P2Y1 Subfamily: P2Y1, P2Y2, P2Y4, P2Y6 and P2Y11 Receptors
All receptors of this subfamily have been cloned and characterized. Pharmacological characterization of P2Y1 showed that in contrast to the other receptors, ADP is a more potent agonist than ATP3.
In platelets, P2Y1 is co-expressed with P2Y12, and is responsible for the initial shape change, aggregation, and rise in intracellular Ca2+ upon activation in response to ADP4.
P2Y1 was isolated from different species including rat, mouse, bovine, and human and its expression was found to be widely distributed along with that of P2Y2 and P2Y4 in Dorsal Root Ganglion (DRG)5,6, bladder7, duodenum8, retina9-11, colon12 (Figure 1) and various cell lines8,13, using Anti-P2Y1 (#APR-009) antibody.
Western blot analysis and immunohistochemistry studies (for the subepithelial fibroblast) show that rat duodenum8 (Figure 2), primary culture of subepithelial fibroblast, 18Co cells and rat cerebrum, express P2Y1. In primary culture of rat DRGs, co-localization of P2Y1 and other ion channels was shown using Anti-P2Y1 antibody in immunocytochemistry5. This study shows that activation of P2Y1 inhibits voltage-activated Ca2+channels in DRGs and might be involved in a mechanism of ADP-induced analgesia5. Activation of P2Y1 also induces the inhibition of the M-Type K+ currents in rat hippocampal pyramidal neurons14. Overexpression of P2Y1 in HEK293 cells was assessed by immunocytochemistry using Anti-P2Y1 antibody14 (Figure 3).
P2Y2 receptor is abundantly expressed in the apical membranes of several epithelial tissues including airway5. It was reported to be expressed, using Anti-P2Y2 antibody (#APR-010), in mouse mesangial cells15, human intestinal epithelium carcinoma cells13, DRGs6 (Figure 4), hippocampus16, retina9,11 (Figures 5 and 6) and bladder7,17,18 (Figure 7).
The involvement of P2Y2 in enhanced neuronal differentiation was demonstrated in mouse DRGs and in PC12 cells. Activation of P2Y2 receptor by ATPγS enhanced NGF-dependent neuronal differentiation and neurite extension19. Expression levels of P2Y2 in rat DRG P2Y2 -/- cells or in PC12 cells treated with siRNA targeted against P2Y2, were assessed by western blot analysis using Anti-P2Y2 antibody19 (Figures 8 and 9).
The P2Y4 receptor is highly expressed in the placenta and to lower extent in lungs and vascular smooth muscles20.
Human P2Y4 receptor is highly selective to UTP, while rat P2Y4 receptor is equally activated by both UTP and ATP and also by other triphosphate nucleotides20.
Expression of P2Y4 and P2Y6 receptors in the intramural ganglia of cat urinary bladder7 (figure 7) and human retina9 (figures 5 and 6) was demonstrated using Anti-P2Y4 (#APR-006) and Anti-P2Y6 (#APR-011) antibodies respectively.
The regulation of ion channels by P2Y receptors was described in several reports. Activation of P2Y receptors by UTP in immortalized human mammary epithelial cells enhanced Na+ transport by activating KCa3.1 (KCNN4) channels21. In this study, the expression of P2Y receptors was confirmed by western blot analysis using the following Anti-P2Y receptors antibodies: Anti-P2Y1, Anti-P2Y2, Anti-P2Y4, Anti-P2Y6, and Anti-P2Y11 (#APR-015) antibodies21.
The P2Y11 receptor is the only subtype coupled to the activation of adenylyl cyclase and PLC, leading to the accumulation of cAMP and inositol phosphates22.
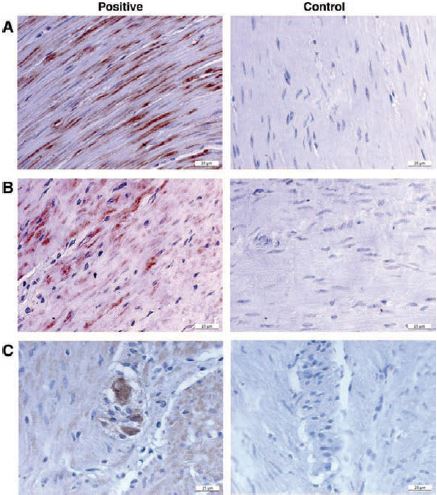
Immunohistochemical staining of P2Y1 in colonic circular smooth muscle (positive and control) in the absence of the primary antibody (A) colonic longitudinal smooth muscle (positive sample and control) (B) and myenteric ganglia (positive sample and control) (C) using Anti-P2Y1 antibody (#APR-009).
Adapted from reference 12 with permission of the American Physiological Society.
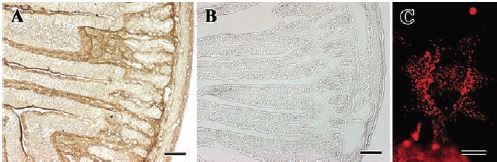
Immunohistochemical and immunocytochemical staining of P2Y1 in rat duodenum and primary culture of subepithelial fibroblasts using Anti-P2Y1 antibody (#APR-009). Cryosections of 6W Wistar rat duodenum were incubated with A) Anti-P2Y1 antibody and B) Anti-P2Y1 antibody pre-absorbed with 2 μg ml-1 antigenic peptide, followed with anti-rabbit Envision+ and visualized with DAB-H2O2 reactions. (C) Subepithelial fibroblasts isolated from rat duodenal villi in primary cultures were incubated with Anti-P2Y1 antibody, then biotinylated anti-rabbit IgG, followed by streptavidin-Texas red. Scale bar in A and B is 100 μm, and in C is 10 μm.
Adapted from reference 8 with permission of The Company of Biologists.
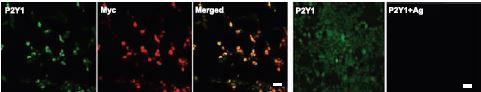
Immunocytochemical staining of P2Y1 in HEK293 cells stably expressing Myc-tagged P2Y1 receptors. Cells were co-reacted with anti-Myc antibody (red) and with Anti-P2Y1 antibody (#APR-009). Reaction was completely blocked by its antigen peptide.
Adapted from reference 14 with permission of The Society for Neuroscience.
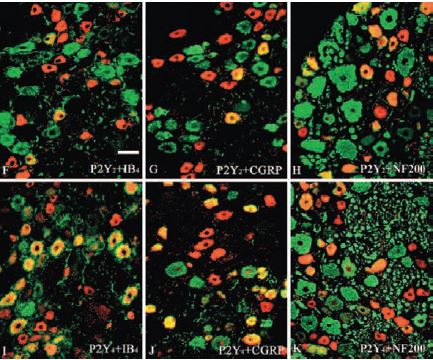
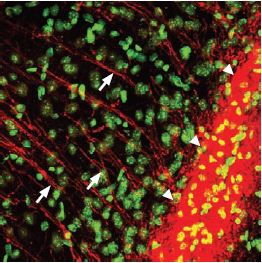
Immunohistochemical staining of P2Y2 and P2Y4 in cat Dorsal Root Ganglia (DRG) using Anti-P2Y2 (#APR-010) and Anti-P2Y4 (#APR-006) antibodies (red) with IB4, CGRP or NF200 (green).
Adapted from reference 6 with permission of the Histochemical Society.
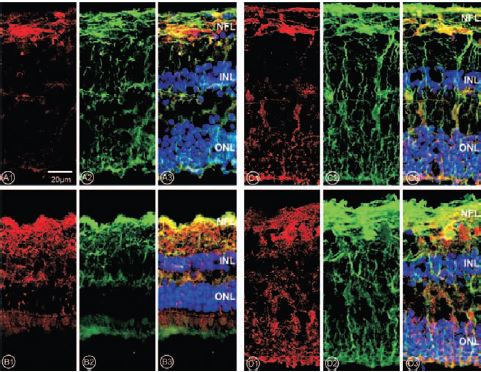
Retinal slices were stained against P2Y1 (A1), P2Y2 (B1), P2Y4 (C1) and P2Y6 (D1) receptors using Anti-P2Y1 (#APR-009), Anti-P2Y2 (#APR-010), Anti-P2Y4 (#APR-006) and Anti-P2Y6 (#APR-011) antibodies (red). Vimentin, a retinal marker (green) was detected (A2, B2, C2, D2). Areas that express both, receptor and vimentin, are shown in yellow (A3, B3, C3, D3). Cell nuclei were stained with Hoechst 33258 (blue). NFL, nerve fiber layer; INL, inner nuclear layer; ONL, outer nuclear layer.
Adapted from reference 9 with permission of the Association for Research in Vision and Ophthalmology.
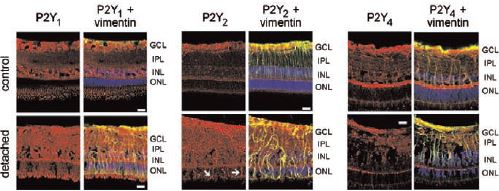
Immunohistochemical staining of P2Y receptors in the porcine retina using Anti-P2Y1 (#APR-009), Anti-P2Y2 (#APR-010), Anti-P2Y4 (#APR-006) antibodies. Slices were derived from nonsurgical control retinas, vitrectomized control retinas and from detached and attached areas of porcine retinas at 7 days after surgery.
Adapted from reference 11 with permission of the Association for Research in Vision and Ophthalmology.
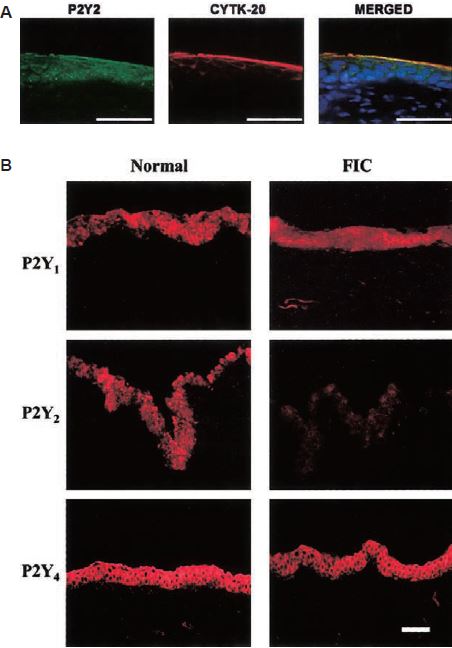
A) Localization of P2Y2 using Anti-P2Y2 antibody (#APR-010) in normal cat uorothelium (left), CYTK-20, a marker for urothelial cells (middle) and representative merged image illustrates the colocalization of P2Y2 and CYTK-20 as well as DAPI (nuclear marker). B) Localization of P2Y1, P2Y2 and P2Y4 in normal (left) and FIC (right) cat urothelium using Anti-P2Y1 (#APR-009), Anti-P2Y2 and Anti-P2Y4 (#APR-006) antibodies.
Adapted from reference 7 with permission of the American Physiological Society.

Western blot analysis of P2Y2 expression in DRG neurons from wildtype and P2Y2 -/- P1 mice using Anti-P2Y2 antibody (#APR-010).
Adapted from reference 19 with permission of The National Academy of Sciences of the USA (copyright 2005).

Western blot analysis of P2Y2 expression in PC12 cells treated with P2Y2 siRNA or scrambled sequence. P2Y2 expression and down-regulation was assessed with Anti-P2Y2 antibody (#APR-010).
Adapted from reference 19 with permission of The National Academy of Sciences of the USA (copyright 2005).
The P2Y12 Subfamily: P2Y12, P2Y13, and P2Y14 Receptors
Expression of P2Y12 and P2Y13 in cholangiocytes (the epithelial cells lining intrahepatic bile ducts) was demonstrated, for the first time, by using Anti-P2Y12 (#APR-012) and Anti-P2Y13 (#APR-017) antibodies in western blots and in immunohistochemical staining (confocal and electron microscopy)23 (Figure 10). Apically applied nucleotides affected the forskolininduced cAMP increase in rat cholangiocytes in a P2Y12-dependent manner. Incubation of the epithelial cells lining intrahepatic bile ducts with siRNA to P2Y12 abolished the effects of ADP on forskolin-induced cAMP levels, as well as P2Y12 protein levels which were confirmed by western blot analysis23. Expression of P2Y12 was also demonstrated in different tissues; western blot analysis showed that in rat spinal cord, P2Y12 expression is upregulated following partial sciatic nerve ligation (using Anti-P2Y12 antibody) and by immunohistochemical staining24. P2Y12 expression was also shown in intramural ganglia of the cat urinary bladder by immunohistochemistry18, in vascular smooth muscle cells and platelets by western blot, where it was also shown that P2Y12 receptor stimulation mediates contraction in human blood vessels25.
P2Y14 is expressed in several tissues including brain, lung and several cells of hematopoietic origin such as T lymphocytes and dendritic cells. The exact function of this receptor in the different tissues has not been clearly established but an involvement in chemotaxis, maturation of immature dendritic cells and neuroimmune regulation has been suggested1.
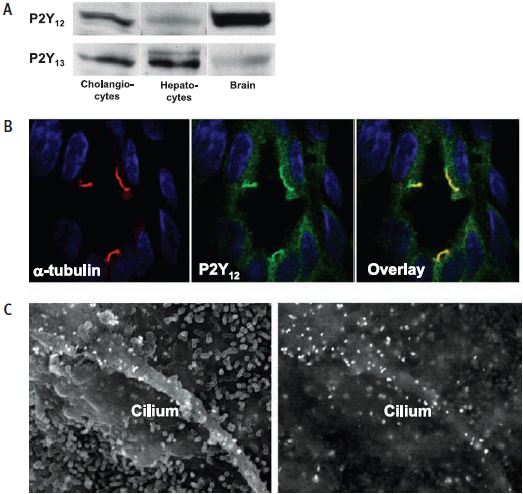
A) Western blot analysis of P2Y12 and P2Y13 expression in cholangiocytes, hepatocytes and brain using Anti-P2Y12 (#APR-012) and P2Y13 (#APR-017) antibodies. B) Immunohistochemical staining in rat liver and immunogold scanning electron microscopy (C) of P2Y12 cholangiocytes cilia.
Adapted from reference 23 with permission of the American Physiological Society.
Immunohistochemical staining of P2Y12 (red) in mouse brain using Anti-P2Y12 antibody (#APR-012). Counterstaining with sytox green (green). The P2Y12 positive fibers (arrows) run from the corpus callosum (triangles) into the deep layers of the entorhinal cortex.

1,3. Anti-P2Y12 antibody (#APR-012), (1:200).
2,4. Anti-P2Y12 antibody, preincubated with the negative control antigen.
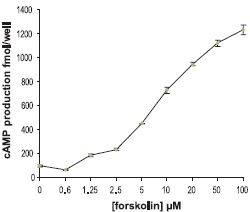
NIH/C6 cells were pre-incubated for 30 min with IBMX (10 µM), and then stimulated for 30 min with Forskolin (#F-500) (0-100 µM). The cell’s content of cAMP was measured by an ELISA kit (Amersham).
References
- Abbracchio, M.P. et al. (2006) Pharmacol. Rev. 58, 281.
- Wang, L. et al. (2002) J. Cardiovas. Pharmacol. 40, 841.
- Vassort, G. (2001) Physiol. Rev. 81, 767.
- Jin, J. et al. (1998) J. Biol. Chem. 273, 2030.
- Gerevich. Z. et al. (2004) J. Neurosci. 24, 797.
- Ruan, H.Z. et al. (2005) J. Histochem. Cytochem. 53, 1273.
- Birder, L.A. et al. (2004) Am. J. Physiol. 287, F1084.
- Furuya, K. et al. (2005) J. Cell Sci. 118, 3289.
- Fries, J.E. et al. (2005) Invest. Ophthalmol. Vis. Sci. 46, 3000.
- Fries, J.E. et al. (2004) Invest. Ophthalmol. Vis. Sci. 45, 3410.
- Iandiev, I. et al. (2006) Invest. Ophthalmol. Vis. Sci. 47, 2161.
- Gallego, D. et al. (2006) Am. J. Physiol. 291, G584.
- Coutinho-Silva, R. et al. (2005) Am. J. Physiol. 288, G1024.
- Filippov, A.K. et al. (2006) J. Neurosci. 26, 9340.
- Rivera, I. et al. (2007) Am. J. Physiol. 292, F1380.
- Rodrigues, R.J. et al. (2005) J. Neurosci. 25, 6286.
- Chopra, B. et al. (2008) Am. J. Physiol. 294, F821.
- Ruan, H.Z. et al. (2006) Am. J. Physiol. 290, F1143.
- Arthur, D.B. et al. (2005) Proc. Natl. Acad. Sci. U.S.A. 102, 19138.
- von Kugelgen, I. and Wetter, A. (2000) Naunyn-Schmiedebergs Arch Pharmacol. 362, 310.
- Tovell, V,E. and Sanderson, J. (2008) Invest. Ophthalmol. Vis. Sci. 49, 350.
- Communi, D. et al. (1997) J. Biol. Chem. 272, 31969.
- Masyuk, A.I. et al. (2008) Am. J. Physiol. 295, G725.
- Kobayashi, K. et al. (2008) J. Neurosci. 28, 2892.
- Wihlborg, A. K. et al. (2004) Arterioscler. Thromb. Vasc. Biol. 24, 1810.